

Angelina Hramatik
Machine Learning Engineer & Researcher
Reading time
20 min read
Machine Learning Applied to 3D Optic Disc Analysis for Glaucoma Risk Assessment Across Different OCT Scan Protocols Without a Normative Database
1. Introduction
Glaucoma is one of the leading causes of irreversible blindness worldwide, affecting millions of people annually. The disease is often asymptomatic in its early stages, making timely diagnosis particularly challenging. Early detection of glaucomatous changes is crucial for preventing vision loss and improving long-term patient outcomes.
One well-established method for assessing glaucoma is the Disc Damage Likelihood Scale (DDLS), which evaluates structural changes in the optic nerve head (ONH) based on the extent of neuroretinal rim loss. This method categorizes glaucomatous damage severity by analyzing the relationship between the optic cup and neural rim, while also accounting for optic disc size without relying on a normative database. 1, 2, 3, 4.
While DDLS is recognized for its reliability and utility in clinical practice, it is not a standalone diagnostic tool. Rather, it is one of several methods used to identify signs of glaucoma, and its implementation is often limited to specific imaging modalities or scan protocols, such as 3D optic disc-only scans or fundus images.
In this article, we introduce an enhanced approach to DDLS analysis that overcomes these limitations. We want to present a solution, which is capable of performing DDLS analysis on any OCT scan protocol that captures the optic nerve, including 3D optic disc scans (which provide the most detailed view of the nerve), as well as OCT horizontal and vertical 3D wide scans. By leveraging advanced machine learning models, we achieve unprecedented flexibility and accuracy, ensuring reliable analysis across different scanning protocols and OCT systems.
Unlike traditional systems restricted to specific devices or data formats, our solution processes scans from multiple OCT systems. Moreover, it excels in challenging scenarios, providing clinicians with a robust and versatile tool for analyzing potential signs of glaucoma.
A Brief Theoretical Overview
Optical coherence tomography (OCT) scans vary in the anatomical regions they capture. One specific type is the optic disc OCT scan (Figure 2), which provides high-resolution imaging of the optic disc and the surrounding optic nerve head (ONH) structures. This scan type is commonly used in glaucoma assessment, as it allows for the evaluation of the optic nerve’s structure, including the neuroretinal rim, optic cup, and surrounding peripapillary retinal nerve fiber layer (RNFL) — key areas affected in glaucomatous damage.
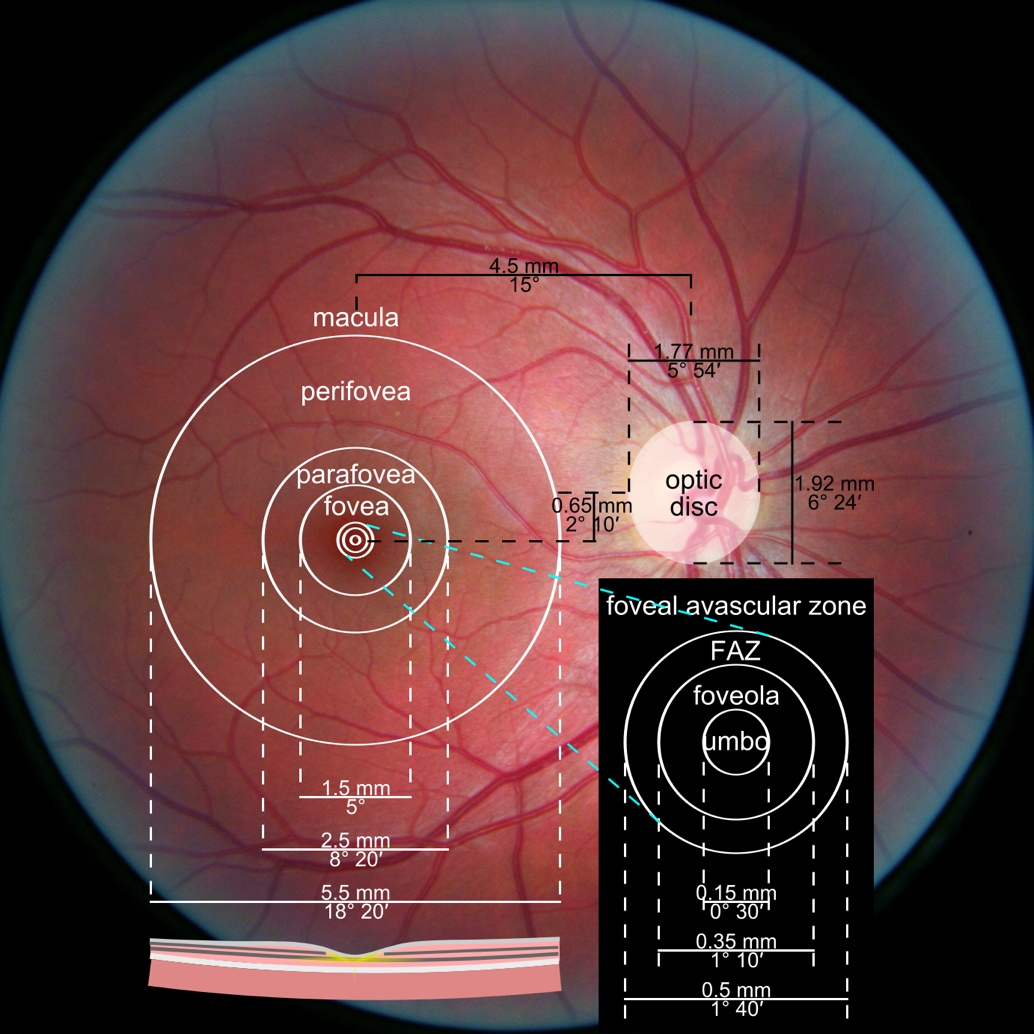
Figure 1. Photograph of the retina of the human eye, with overlay diagrams showing the positions and sizes of the macula, fovea, and optic disc (Reference).
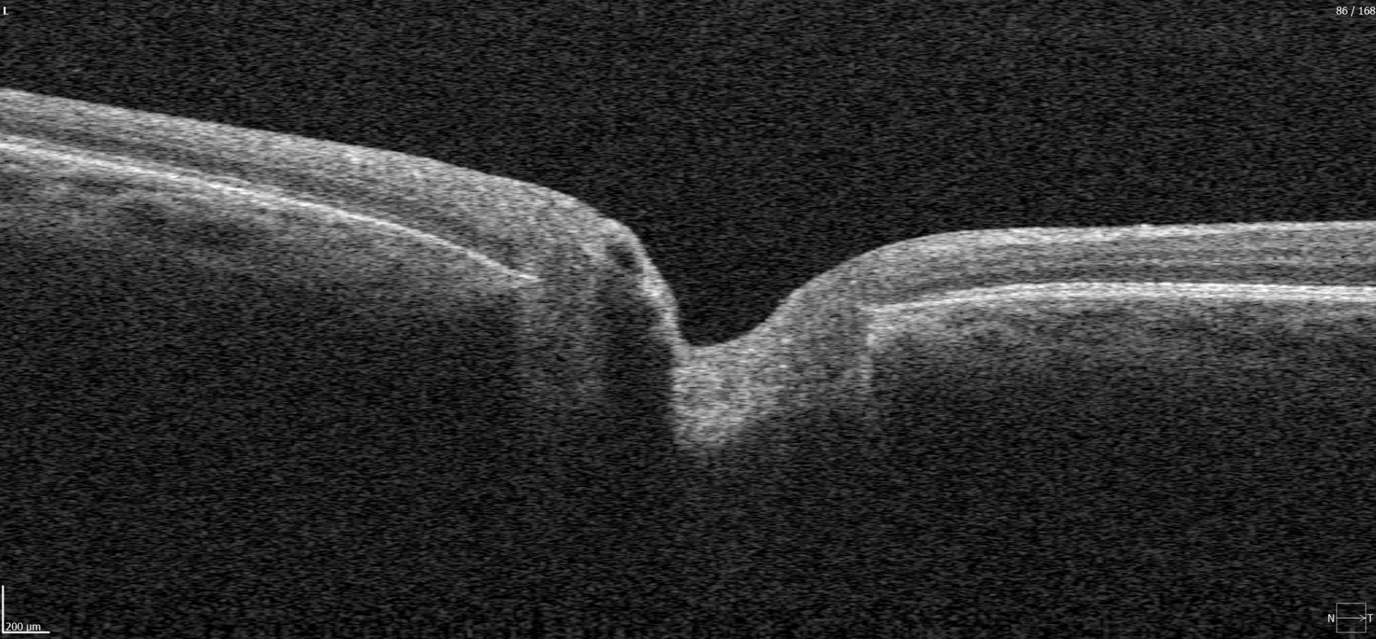
Figure 2. 6 mm OCT b-scan of the optic nerve head (ONH) region.
In contrast, macular OCT scans (Figure 3) focus on the central retina, providing detailed visualization of structures such as the foveal center, retinal layers, and macular biomarkers (such as drusen, hypertransmission, fluids etc). Since the macula is anatomically distinct from the optic nerve head, standard macular scans do not capture the ONH comprehensively.
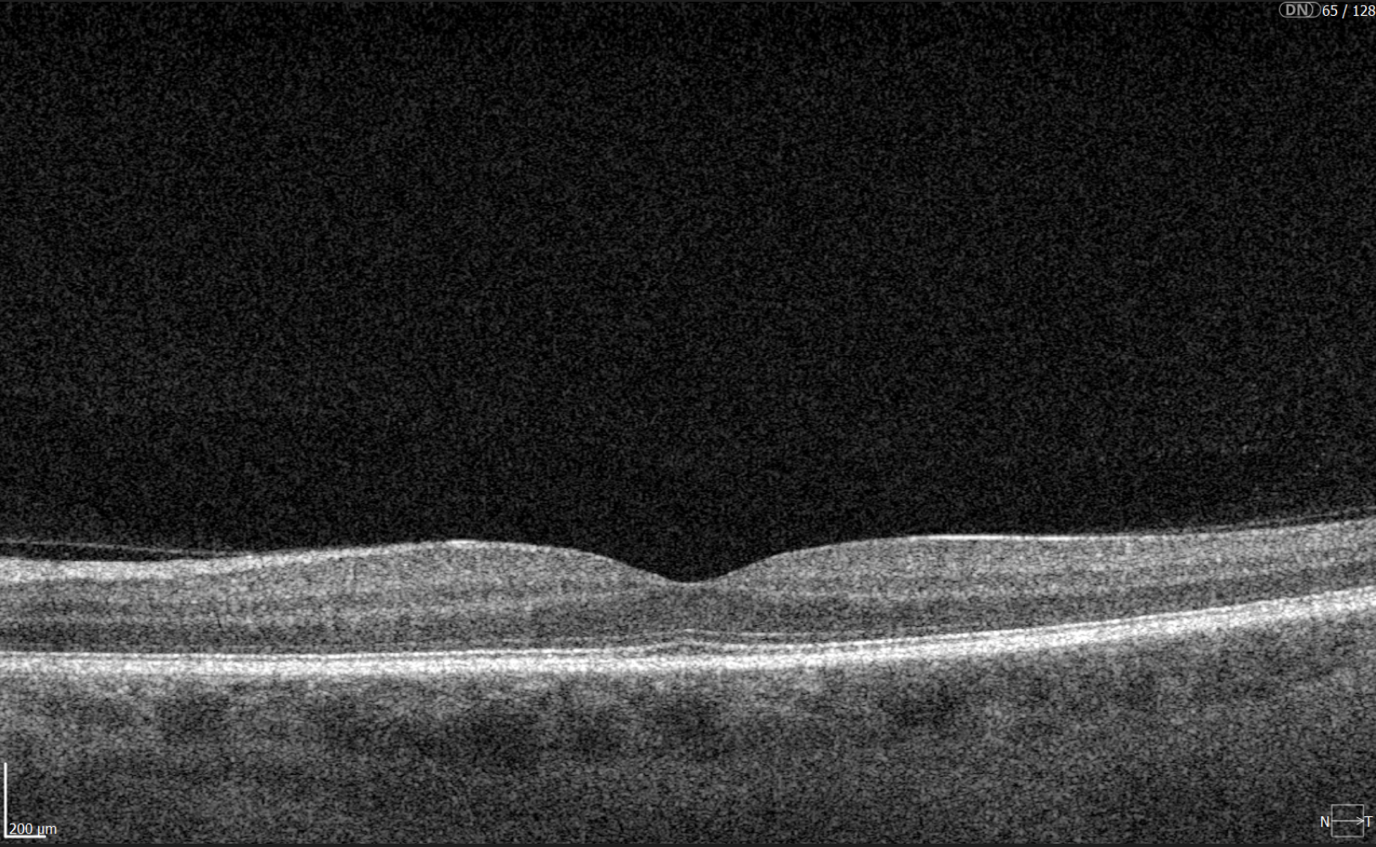
Figure 3. 6 mm OCT b-scan of the macular region, showing the foveal pit and retinal layers.
A more comprehensive scanning approach is 12 mm wide scan OCT (Figure 4), which captures both the macular region and optic nerve head in a single scan. This broader field of view allows for the simultaneous assessment of central retinal structures and optic nerve-related changes, making it valuable for detecting and monitoring conditions that affect both regions, such as glaucoma and other neurodegenerative or vascular retinal diseases.
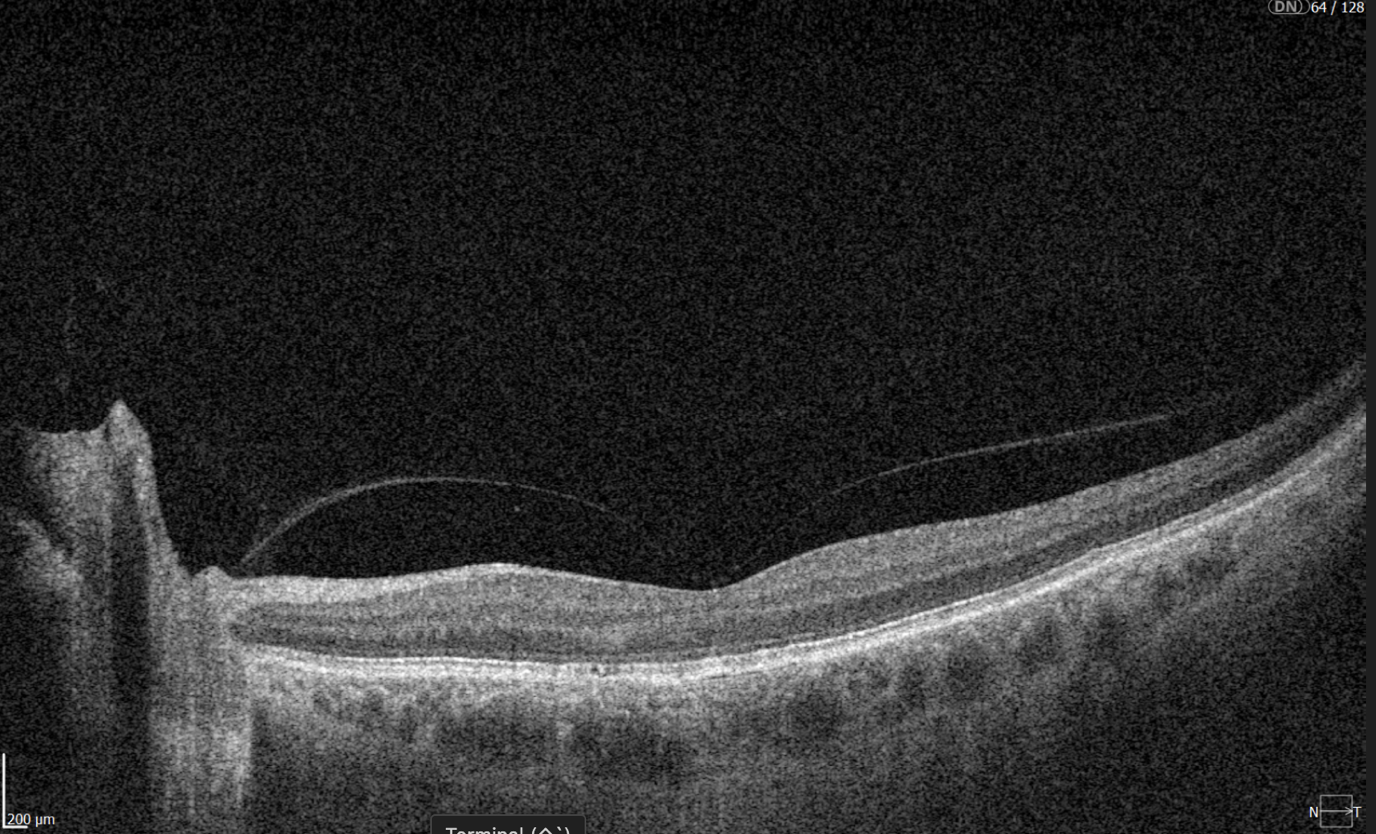
Figure 4. 12 mm wide scan OCT b-scan, which captures both the macular region and part of the optic nerve head.
2. Results
2.1. Experiment Setup
Brief Method Overview
To evaluate the effectiveness of DDLS analysis in assessing glaucoma severity, we designed an experiment comparing results obtained from processing 3D Optic Disc OCT scans and 3D Wide scan OCT scans with the corresponding reports generated by the OCT system. Our method follows four key steps:
- Detecting optic nerve landmarks like Bruch’s Membrane Opening (BMO) points (Eye Keypoints Retrieval / OCT Keypoint Detector Model);
- Segmenting the inner limiting membrane (ILM) (Retina Layers Segmentation Model);
- Reconstructing the neuroretinal rim geometry;
- Applying the Disc Damage Likelihood Scale (DDLS) for classification.
The dataset below was used to validate the algorithm.
Dataset Used for Validating the Entire Algorithm
For validation, we compared our algorithm’s DDLS measurements with the DDLS values generated by the built-in algorithms of the Optopol REVO NX 130 OCT system. This provided a baseline for assessing accuracy and consistency.
To validate our approach, we conducted an experiment comparing DDLS metrics derived from:
- 3D Optic Disc OCT scans, which are traditionally used for DDLS analysis.
- 3D Wide scans, which capture both the macular and optic nerve regions, providing a more comprehensive dataset for analysis.
The dataset includes imaging data from 37 patients examined using the Optopol REVO NX 130 OCT system, with each patient undergoing the following protocols on the same day:
- 3D Optic Disc OCT (6mm zone): 168 scans
- 3D Wide scan (horizontal protocol, 12mm): 128 scans
A report was obtained from the 3D Optic Disc OCT scans, containing all parameters calculated by the device.
Since no manual annotations are available for these data, our comparison is conducted directly against the device-generated results.
The distribution of data was as follows:
- Glaucomatous Optic Disc: 21 cases;
- Normal Optic Disc: 16 cases.
2.2. Final Validation Results: DDLS Accuracy and Error Metrics
To evaluate the performance of our DDLS analysis method, we compared its results with the corresponding DDLS values generated by the OCT device’s built-in algorithms. The device reports serve as a reference point for all calculations, meaning the accuracy, MAE/STD values presented below indicate the level of agreement between our method and the device’s measurements.
The parameters compared below are the key indicators for glaucoma stage assessment.
- The rim-to-disc ratio (RDR) represents the thinnest neuroretinal rim width relative to the vertical optic disc diameter. A lower RDR indicates a more advanced stage of rim thinning, as glaucoma leads to progressive narrowing of the neuroretinal rim due to the loss of ganglion cells axons.
- The rim absence angle (RAA) quantifies the extent of neuroretinal rim loss in degrees. It defines the angle where the rim is completely absent, exposing the optic cup. A wider RAA suggests a more severe stage of glaucoma, as it indicates greater rim loss across the disc circumference.
Both RDR and RAA provide complementary perspectives on structural optic nerve damage:
- RDR measures the smallest remaining rim thickness in proportion to the disc.
- RAA evaluates how much of the disc circumference has lost its rim.
By considering both parameters together, a more comprehensive assessment of glaucoma severity can be achieved. Based on RDR and RAA, a DDLS stage is assigned, allowing for standardized classification of glaucoma progression.
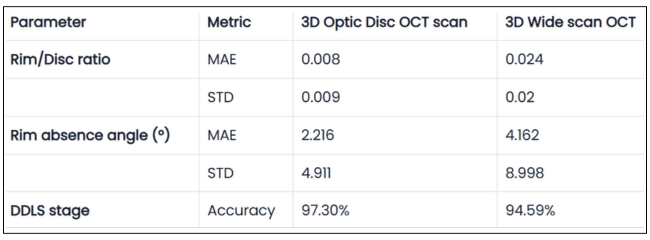
Table 1. Validation Results of DDLS Analysis on 3D Optic Disc and 3D Wide Scan OCT Scans
The table presents validation results comparing 3D Optic Disc OCT scan and 3D Wide scan OCT in DDLS analysis, focusing on Mean Absolute Error (MAE) and Standard Deviation (STD) for key parameters, along with overall DDLS staging accuracy. These metrics are calculated for the rim-to-disc ratio and rim absence angle by comparing their respective values from 3D Optic Disc OCT scans and 3D Wide scans against those from the device reports, providing a precise assessment of deviations from the reference values.
Key Observations
1. Our Goal: Consistency with Device Reports, Not Outperformance
The experiment does not aim to surpass the device’s accuracy but rather to demonstrate that our method produces results in alignment with the device-generated DDLS reports.
The device report serves as a reference, helping to interpret the figures we present, but this does not mean the device’s output is always the absolute truth.
2. High DDLS Staging Accuracy for Both Scan Types
3D Optic Disc OCT scan: 97.3% accuracy in determining DDLS glaucoma stage.
3D Wide scan OCT: 94.59% accuracy, demonstrating strong reliability despite a broader scan area and fewer scans capturing the nerve, leading to less available information.
Conclusion:
- Both types of scans allow the production of clinically reliable DDLS results, but as expected, 3D optic disc scans provide slightly better accuracy due to their higher resolution of the optic nerve head (ONH).
- The small accuracy gap and close values for key parameters between the two suggests that 3D wide scan OCT can still be a viable option for glaucoma assessment, despite offering less detailed information about the optic nerve compared to optic disc scans.
3. RD Ratio and Rim Absence Angle: High Precision Within Clinical Margins
RD Ratio (rim-to-disc ratio):
- Step size between DDLS stages: 0.1.
- Mean Absolute Error (3D Optic Disc OCT scan): 0.008 (significantly smaller than step size).
- Mean Absolute Error (3D Wide scan OCT): 0.024 (still relatively small).
Conclusion:
- Both 3D Optic Disc OCT scan and 3D Wide scan analysis provide high precision in RD ratio calculations.
- The small error ensures that stage classification remains reliable, especially in optic disc scans.
Rim Absence Angle:
- Step size between DDLS stages: Minimum 45°.
- Mean Absolute Error (3D Optic Disc OCT scan): 2.2° (very small compared to step size). Mean Absolute Error (3D Wide scan OCT): 4.2° (still well below stage transition threshold).
Conclusion:
- The method’s margin of error is far smaller than the clinical threshold for stage differentiation, confirming high accuracy in rim loss assessment.
- 3D Optic Disc scans again show better precision, reinforcing that they remain the preferred scan type for DDLS.
4. Our Advantage: Ability to Perform DDLS on Both Scan Types
- Unlike traditional DDLS implementations, which work only with 3D Optic Disc scans, our method can perform DDLS analysis on both 3D Wide scan and 3D Optic Disc OCTs.
- However, 3D Optic Disc OCT remains the preferred method for maximum precision, as it provides a higher-resolution view of the optic nerve.
Key Conclusions
- Our method is unique in its ability to process multiple scan types, while still maintaining high accuracy in both cases.
- On 3D Optic Disc scans, we achieve maximum precision, while on 3D Wide scans, we still maintain clinically reliable accuracy.
- Consistency: Across all glaucoma stages, our method produced stable results that closely matched ground truths provided by medical experts.
- Universal Compatibility: The algorithm performed equally well with scans from other manufacturers, demonstrating its versatility and robustness.
2.3. Patient Case Studies: DDLS Analysis in Real-World Scenarios
Accurate assessment of glaucoma severity relies on precise measurements of optic nerve parameters, such as disc area, rim-to-disc ratio, and rim absence angle. In the following examples, we analyzed four patient cases, including both normal optic discs and glaucomatous eyes, using 3D Optic Disc OCT scan, 3D Wide scan OCT, and device-generated reports as a reference standard.
By consolidating individual patient cases into a single comparative table, we can examine the consistency of DDLS analysis across different scan types and highlight key variations that may arise due to differences in scan coverage, segmentation accuracy, and anatomical structure. The following table summarizes the key optic nerve parameters measured for each patient and scan type.
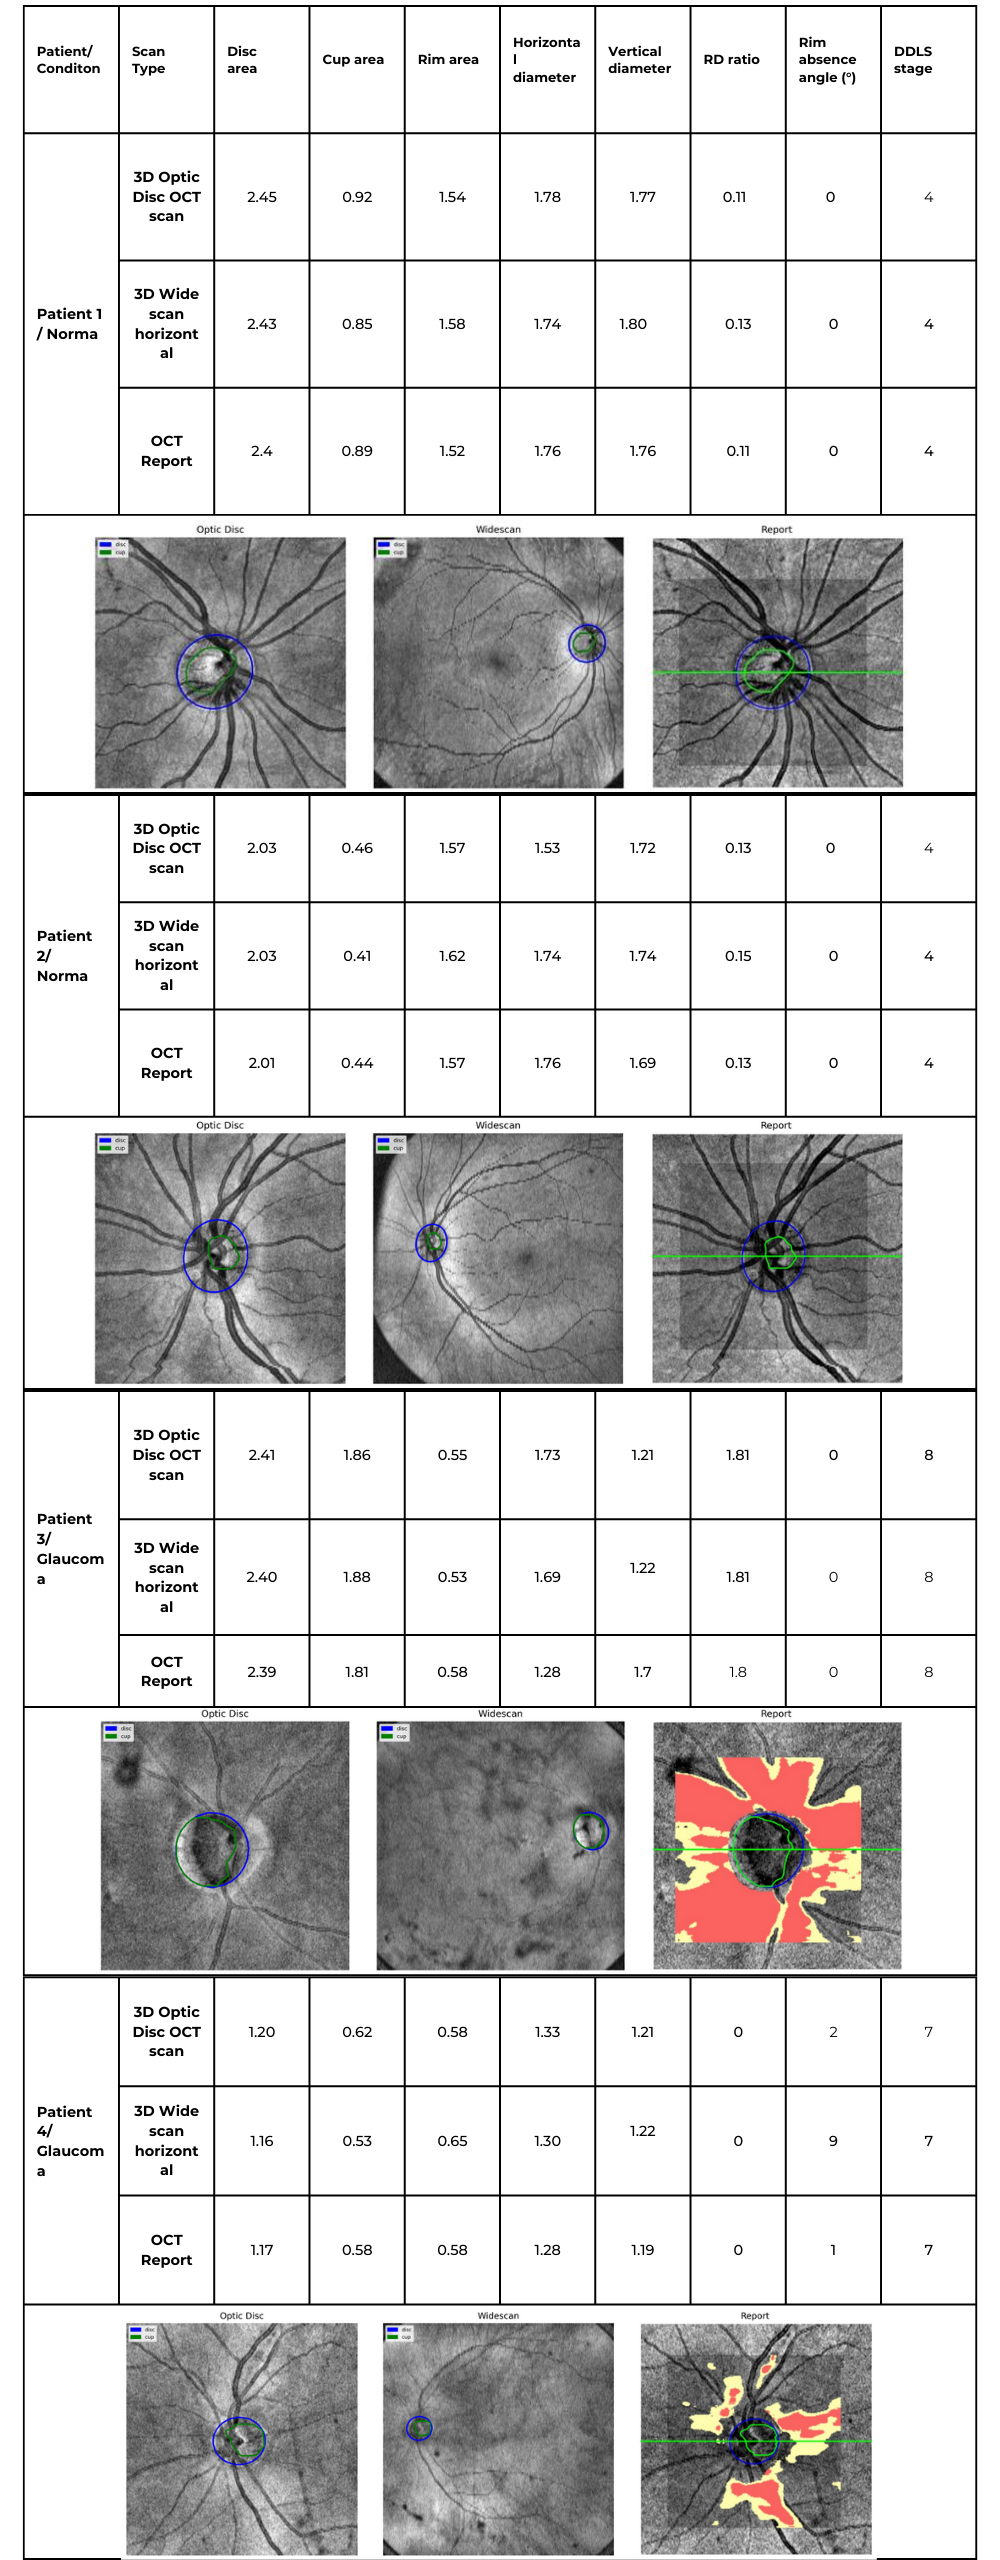
Table 2. Comparative DDLS Evaluation Across Multiple Patient Cases
Key Findings & Interpretation
1. High Consistency Between Our Method and Device Reports
- Across all cases, the DDLS stage remains identical (4 for normal eyes, 7 or 8 for glaucomatous cases) regardless of whether the input scan was 3D Optic Disc OCT or wide scan, and this result corresponds to the device-generated report.
- Key optic nerve parameters such as disc area, cup area, and rim area closely align with the device reference, demonstrating strong algorithm performance.
2. Minor Variations in Cup and Rim Measurements
- Cup and rim area values show slight deviations between 3D Optic Disc OCT scans and 3D Wide scan scans, which is expected due to differences in scan coverage and segmentation sensitivity.
- For example, in Patient 3 (Glaucoma, Stage 8):
- Cup area was 1.86 mm² (3D Optic Disc OCT scan), 1.88 mm² (3D Wide scan), and 1.81 mm² (Device Report).
- Rim area was 0.55 mm² (3D Optic Disc OCT scan), 0.53 mm² (3D Wide scan), and 0.58 mm² (Device Report).
- These small variations do not affect final DDLS staging but highlight how scan type can introduce subtle segmentation differences.
3. Rim Absence Angle Varies Slightly but Remains Within Expected Tolerances
- The rim absence angle shows minor fluctuations across scan types, especially in glaucomatous cases.
- Example: In Patient 3 (Stage 8 Glaucoma), the device reported a rim absence angle of 162°, while our algorithm calculated 155° (3D Optic Disc OCT scan) and 151° (3D Wide scan).
- Since DDLS categories for severe glaucoma are defined in large increments (e.g., 45°+ thresholds), these small differences do not impact staging accuracy.
4. 3D Wide scan OCT Provides Comparable Results to 3D Optic Disc OCT scan
- Despite covering a larger field of view, wide scans produced DDLS staging results consistent with 3D Optic Disc OCT scans and device reports.
- In patients with coexisting macular pathologies, 3D Wide scan OCT may provide additional clinical insights while still maintaining high reliability for glaucoma staging.
Conclusion: Reliable DDLS Analysis Across Different Scan Types
This unified case study analysis confirms that our DDLS analysis algorithm produces highly consistent results across different scan protocols and patient conditions.
- DDLS stage assignment is identical to device reports across all scan types, ensuring high agreement with clinically validated reference values.
- Key optic nerve measurements (disc area, cup area, rim area) are closely aligned across 3D Optic Disc OCT scan, 3D Wide scan, and device reports, reinforcing algorithm accuracy.
- Minor variations in rim absence angle and segmentation metrics do not affect final glaucoma staging, highlighting the algorithm’s robustness.
- 3D Wide scan OCT offers a viable alternative for 3D Optic Disc OCT scans, particularly in cases where both macular and optic nerve regions need simultaneous evaluation.
5. Visual Comparison Shows Strong Similarity to Device Reports
- The disk and cup boundaries detected by our algorithm closely match those in the device-generated reports, maintaining consistent shapes and anatomical alignment across both 3D Optic Disc and 3D Wide scan OCT scans.
- However, wide scan-based segmentations tend to be slightly rougher, as less structural information is available compared to dedicated optic disc scans. This trade-off is expected due to the broader field of view in wide scans.
These findings validate our algorithm’s flexibility, adaptability, and clinical reliability, demonstrating its potential for seamless integration into real-world ophthalmic workflows.
2.4. Why Our Approach Stands Out: Key Advantages Over Traditional DDLS Systems
While the previous patient case studies demonstrated the accuracy and consistency of our DDLS analysis across different optic disc conditions, another critical advantage of our method is its ability to work seamlessly across various scanning protocols. Unlike traditional device-restricted solutions, our approach supports DDLS assessment on both standard 3D Optic Disc OCT scans and 3D Wide scans with different orientations.
The following table illustrates the same patient’s optic nerve head analyzed using three different scanning protocols: 3D Optic Disc OCT scan, 3D Wide scan Horizontal, and 3D Wide scan Vertical. This comparison highlights the method’s adaptability to different scan formats, ensuring reliable DDLS analysis regardless of the scanning protocol used. This example is taken from a Topcon Maestro 2 OCT system, providing an additional reference for processing across different OCT systems.
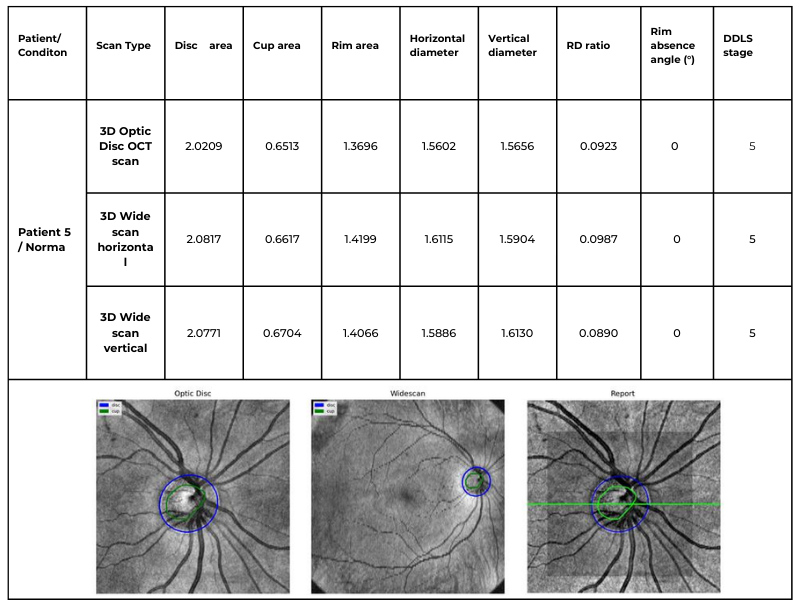
Table 3. Comparative DDLS Analysis Across Different Scanning Protocols: 3D Optic Disc OCT, 3D Wide scan Horizontal, and 3D Wide scan Vertical.
This capability significantly enhances clinical applicability, allowing our algorithm to process data from various scanning protocols and devices while maintaining high accuracy. The ability to analyze both 3D Optic Disc and 3D Wide scan OCT scans — across different orientations and machine types — ensures comprehensive glaucoma assessment even in cases where scan availability or quality may vary.
Key advantages over traditional DDLS analysis methods
1. Device Independence
- While most existing solutions are restricted to proprietary OCT data formats, our algorithm processes scans from any OCT system, ensuring broad compatibility across devices.
2. Consistent Accuracy Across Different Scan Types
- Our algorithm closely matches device-generated DDLS reports, achieving 97.3% accuracy for 3D Optic Disc OCT scans and 94.59% for 3D Wide scan OCTs.
- Patient cases confirm this consistency, with both normal and glaucomatous eyes correctly classified, even when analyzed with different scan types.
3. Robust Performance in Edge Cases
- Unlike traditional device-based DDLS assessments, which may struggle with low-quality images or atypical anatomical features, our approach maintains high accuracy in challenging clinical scenarios.
- Patient examples with small optic discs and advanced-stage glaucoma demonstrated that our algorithm successfully identified key DDLS indicators even when scan quality or nerve structure was less distinct.
4. Expanded Assessment Through 3D Wide scan OCT
- The ability to perform DDLS analysis on Horizontal and Vertical 3D Wide scans allows for a more comprehensive evaluation by incorporating both macular and optic nerve data.
- In patients with coexisting macular pathologies, wide scans enabled earlier detection of glaucomatous changes that would have been missed if only optic disc scans were used.
3. Detailed Approach Description
To assess glaucoma stage on OCT scans using DDLS analysis, the following steps should be performed:
- Optic Nerve Landmarks Detection – Localization of the optic nerve in the b-scan view of each scan by identifying key anatomical landmarks.
- ILM Detection – Segmentation of the inner limiting membrane (ILM) in the b-scan view of each scan to establish a reference for neuroretinal rim measurement.
- Neuroretinal Rim Reconstruction – Construction of the neuroretinal rim geometry based on detected nerve landmarks and ILM segmentation.
- DDLS Analysis – Application of the Disc Damage Likelihood Scale (DDLS) to assess glaucoma severity based on neuroretinal rim measurements. This includes assigning a DDLS stage according to rim width and optic disc size, with a focus on detecting localized thinning and asymmetry.
3.1. Keypoint Annotation Process / Nerve Detection
The foundation of our approach lies in a high-quality, annotated dataset meticulously labeled by a team of four expert ophthalmologists. The annotation process focused on identifying key anatomical landmarks in both the macular region and the optic disc nerve zones, both of which are critical for detecting glaucomatous changes and performing Disc Damage Likelihood Scale (DDLS) analysis.
These keypoints serve as essential data for evaluating disease progression and training machine learning models. The dataset was carefully selected based on key clinical features, such as the presence or absence of nerve fibers, foveal pits, and other pathological markers, ensuring a comprehensive representation of various conditions and scan types.
The annotated dataset consists of approximately 370 unique OCT examinations with more than 56,000 b-scans, covering a range of physical scanning areas, pathology types, and optic nerve conditions to enhance the model’s robustness. The scans are categorized as follows:
- Optic Disc with no excavation: ~15 examinations;
- Glaucomatous Optic Disc: ~105 examinations;
- Normal Optic Disc: ~105 examinations;
- Wide scans (covering both the macular and optic nerve regions): ~60 examinations;
- Normal Retina Scans: ~40 examinations;
- Pathological Retina Scans: ~45 examinations.
This detailed annotation process ensures high precision and reliability, enabling the algorithm to generalize across diverse cases while maintaining clinical accuracy in real-world scenarios.
3.2. Eye Keypoints Retrieval / OCT Keypoint Detector
Our keypoint detection model represents a logical evolution of the model for exam center detection, designed to efficiently and accurately identify key anatomical landmarks in OCT scans. The architecture integrates elements from UNet 5 and CenterNet 6, incorporating YOLO-inspired 7 techniques for keypoint prediction. Additionally, the backbone has been adapted to a transformer-based model 8, enhancing feature extraction capabilities.
Training Process
The training process follows a multi-stage approach, ensuring robustness, accuracy, and efficiency:
- Stage 1: Detects general keypoints, establishing a foundation for precise landmark localization.
- Stage 2: Groups and refines the identification of specific keypoints, progressively improving the model’s understanding of anatomical structures.
This structured approach enhances the model’s reliability across different scan types while maintaining computational efficiency.
Key Features
Data Preprocessing
- The data is augmented using unsupervised techniques, leveraging libraries such as Albumentations 9 to introduce variations such as rotations, scaling, and noise addition.
- This ensures the model encounters a wider variety of real-world scenarios during training, improving its generalization capability.
Training Process
- The model is trained using supervised learning techniques, optimizing a loss function through backpropagation and gradient descent.
- This approach allows for continuous refinement and adaptation to complex variations in OCT scans.
Parameterization & Tuning
- The model includes millions of adjustable parameters (weights), which are fine-tuned to increase accuracy.
- Key hyperparameters such as learning rate, batch size, and network depth are carefully selected to maximize performance.
- Advanced optimization techniques, including grid search, random search, and Bayesian optimization, are used to find the best hyperparameter configuration.
3.3. Retina Layers Segmentation Model
The Retina Layers Segmentation Model is our production-stage model, actively used within the Altris AI platform. It was incorporated into this experiment without modifications, ensuring that the results reflect real-world performance as seen in our deployed system.
Our Retina Layers Segmentation Model enables precise segmentation of key retinal layers in OCT scans, crucial for detecting structural changes linked to glaucoma and other retinal diseases. The model identifies:
- ILM, RNFL, GCL, IPL, INL, OPL, ONL, ELM, MZ, EZ, OS, RPE, BM
The training dataset consists of 5,000 expert-annotated OCT b-scans, covering a diverse range of patient demographics, including different ages and ethnic backgrounds. The segmentation model is designed to detect and delineate key retinal layers with high accuracy.
Training & Architecture
The model is based on U-Net with a ResNet backbone, optimized for OCT images. Training includes:
- Expert Annotation: Medical specialists labeled layers for ground truth.
- Augmentation: Albumentations-based transformations enhance robustness.
- Supervised Learning: Predicts segmentation masks using backpropagation.
- Hyperparameter Optimization: Grid search, random search, and Bayesian tuning maximize performance.
Model Validation & Performance
- The model was validated using a holdout validation approach, with separate validation and test sets that were not exposed during training.
- Real-world testing was conducted using scans from various clinical settings to ensure robustness.
- Performance was evaluated using the Mean Dice Coefficient across all layers, achieving a score of 0.80, with layer-specific scores ranging from 0.63 to 0.92, confirming high segmentation accuracy.
- Cross-domain testing demonstrated consistent performance across different OCT systems, and stability was confirmed over scans collected across different time periods.
This efficient, accurate, and generalizable model strengthens DDLS analysis and enhances AI-driven retinal diagnostics.
3.4. DDLS Algorithm
The DDLS algorithm evaluates glaucomatous changes by analyzing the geometric relationship between the neural rim and optic cup in the optic nerve head. Key steps include:
- Localization: Identifying boundaries of the optic cup and neuroretinal rim by reconstructing geometry on a b-scan view using disc landmarks and an inner limiting membrane.
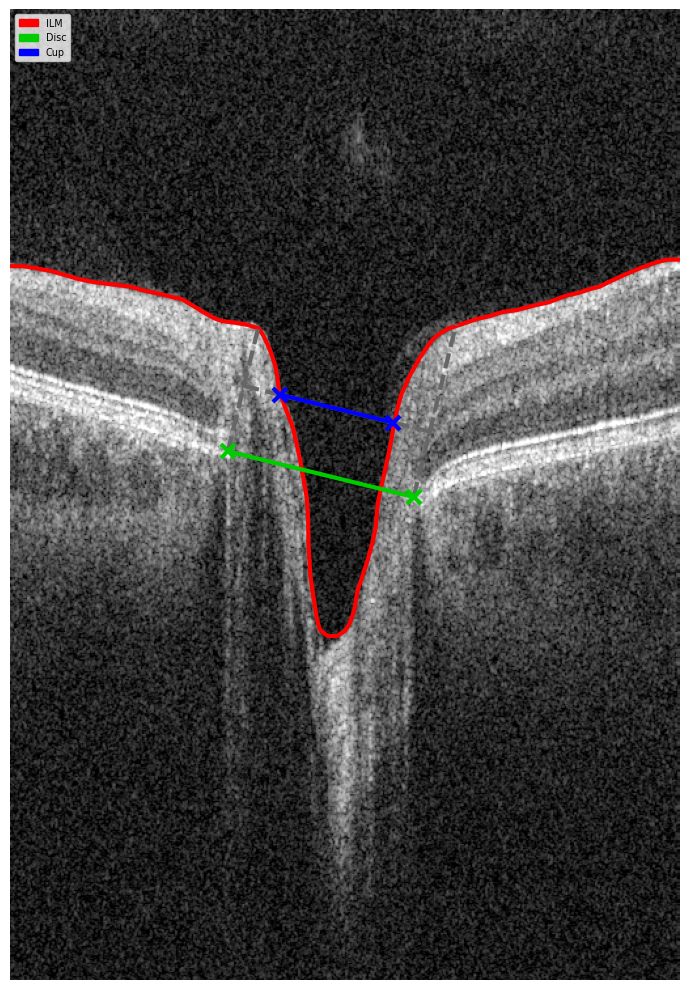
Figure 5. B-scan Geometry Visualization.
- Measurement: Calculating the DDLS stage based on the ratio between the rim and disc boundaries.
- Cross-Scan Application: Adapting the analysis for 3D Wide scans (both Horizontal and Vertical protocols) as well as 3D Optic Disc-specific scans.
Our implementation enhances this traditional method by leveraging wide scans, enabling a more comprehensive assessment of glaucomatous changes.
3.5. Evaluation
To ensure the reliability and effectiveness of our DDLS algorithm, we conducted a rigorous evaluation process, adhering to best practices in data usage, ethics, and performance validation.
Data Integrity
- Measures were implemented to prevent data leakage, ensuring that scans from the same patient did not appear in both training and testing sets.
Ethical Considerations
- The analysis strictly relies on OCT-related data (e.g., scan zone size, laterality, pixel spacing) without incorporating any personal patient information.
Performance Metrics
- Keypoint detection accuracy was evaluated using Mean Squared Error (MSE), comparing model-predicted keypoints with expert annotations.
- Additional metrics included correctness of scan center-related landmarks and accuracy in the optic nerve region, ensuring precision in clinical applications.
The evaluation results confirmed the algorithm’s robustness, demonstrating significant performance gains, particularly in edge cases, where traditional methods often struggle.
Discussion
Our DDLS analysis method represents a significant advancement in glaucoma detection. Key benefits include:
- Universal Compatibility: The ability to process data from various devices ensures broad applicability.
- Enhanced Accuracy: By incorporating data from both macular and optic nerve regions, our approach captures more subtle glaucomatous changes.
- Edge Case Performance: Advanced machine learning techniques enable accurate analysis even in challenging scenarios.
Compared to traditional methods, our system provides a more flexible, reliable, and comprehensive solution for early glaucoma detection.
Disclaimer: USA FDA 510(k) Class II; Altris Image Management System (Altris IMS); AI/ML models and components intended to use for research purposes only, not for clinical diagnosis purposes.
Conclusion
By integrating 3D Wide scans and state-of-the-art machine learning models, we have enhanced DDLS analysis for glaucoma detection, ensuring high accuracy, broad compatibility, and robustness across diverse clinical scenarios.
Unlike traditional solutions, our algorithm:
- Works across multiple OCT devices, eliminating the constraints of proprietary data formats.
- It closely matches device-generated DDLS reports, achieving 97.3% accuracy for 3D Optic Disc OCT scans and 94.59% for 3D Wide scans.
- Performs reliably in edge cases, such as small optic discs and advanced-stage glaucoma, where traditional methods may struggle.
- Supports both Horizontal and Vertical 3D Wide scans, enabling more comprehensive assessments that incorporate both macular and optic nerve data.
- Enhances early glaucoma detection, particularly in patients with coexisting macular pathologies, where wide scans provide additional clinical insights.
By delivering consistently accurate DDLS staging, regardless of scan type or manufacturer, our system establishes a new benchmark for universal glaucoma assessment. This technology has the potential to significantly improve early detection and management, ultimately preserving vision and enhancing patient outcomes.
References
- Spaeth, G. L. (2005). The Disc Damage Likelihood Scale. Glaucoma Today. https://glaucomatoday.com/articles/2005-jan-feb/0105_18.html
- Cheng, K. K. W., & Tatham, A. J. (2021). Spotlight on the Disc-Damage Likelihood Scale (DDLS). Clinical Ophthalmology, 15, 4059–4071. https://pmc.ncbi.nlm.nih.gov/articles/PMC8504474/
- Zangalli, C., Gupta, S. R., & Spaeth, G. L. (2011). The disc as the basis of treatment for glaucoma. Saudi Journal of Ophthalmology, 25(4), 381-387. https://www.sciencedirect.com/science/article/pii/S1319453411000993
- Review of Optometry Staff. (2023, January 23). Optic disc staging systems effective in grading advanced glaucoma. Review of Optometry. https://www.reviewofoptometry.com/article/optic-disc-staging-systems-effective-in-grading-advanced-glaucoma
- Ronneberger O, Fischer P, Brox T. U-Net: Convolutional Networks for Biomedical Image Segmentation. [Preprint]. Posted May 18, 2015. https://arxiv.org/abs/1505.04597
- Duan K, Bai S, Xie L, et al. CenterNet: Keypoint Triplets for Object Detection. [Preprint]. Posted April 17, 2019. https://arxiv.org/abs/1904.08189
- Redmon J, Divvala S, Girshick R, Farhadi A. You Only Look Once: Unified, Real-Time Object Detection. [Preprint]. Posted June 8, 2015. https://arxiv.org/abs/1506.02640
- Dosovitskiy A, Beyer L, Kolesnikov A, et al. An Image is Worth 16×16 Words: Transformers for Image Recognition at Scale. [Preprint]. Posted October 22, 2020. https://arxiv.org/abs/2010.11929
- Buslaev A, Iglovikov V, Khvedchenya E, et al. Albumentations: Fast and Flexible Image Augmentations. [Preprint]. Posted September 18, 2018. https://arxiv.org/abs/1809.06839