

Maria Martynova
Pediatric ophthalmologist, Retina imaging expert
Medical expert at Altris, Inc.
Reading time
8 min read
The average OCT device is a significant investment, costing upwards of $40,000. As eye care specialists, we recognize the revolutionary power of OCT. However, patients often receive only a standard OCT report from this investment. Unfortunately, many patients are unaware of OCT’s true value and may not even know what it is. This raises a crucial question: are these standard reports truly reflecting the full diagnostic potential of such an expensive and sophisticated device? Are we, as professionals, maximizing the capabilities of this technology to ensure optimal patient care?
This article explores how OCT Reports address these shortcomings, enhancing diagnostic accuracy, treatment monitoring, referral efficiency, patient education, and audit readiness.
FDA-cleared AI for OCT analysis
Common OCT reports and their limitations
How does the standard report look?
OCT has become a golden standard for diagnosing and monitoring many ocular pathologies, thanks to its unparalleled level of detail in ophthalmic imaging.
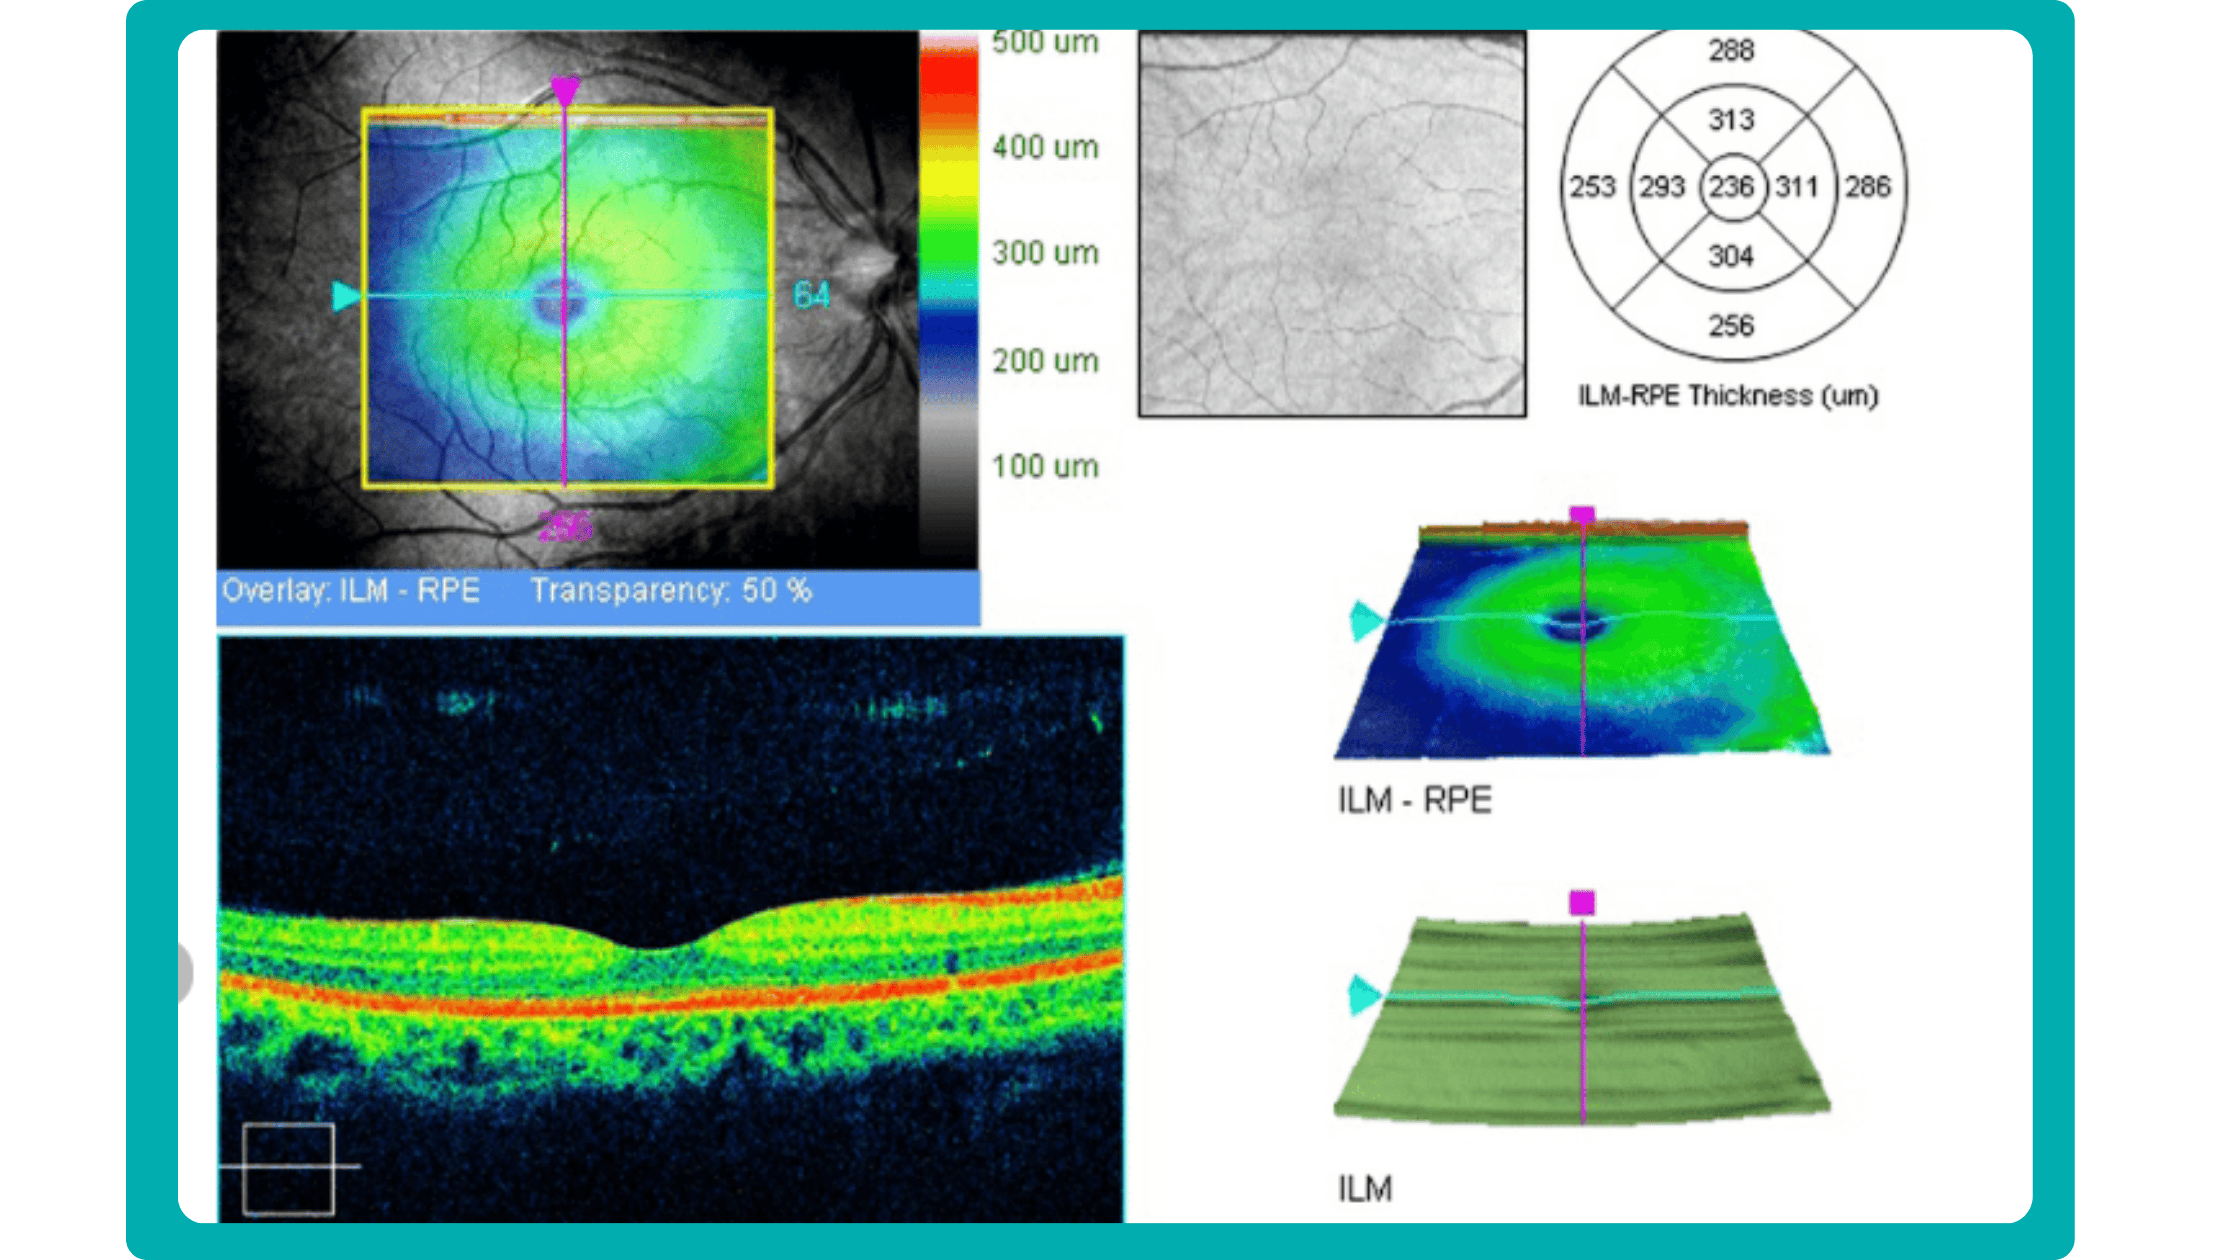
While retinal reports vary among OCT models, they typically include:
- a foveally centered B-scan,
- a quantitative thickness map,
- and a semi-quantitative thickness map.
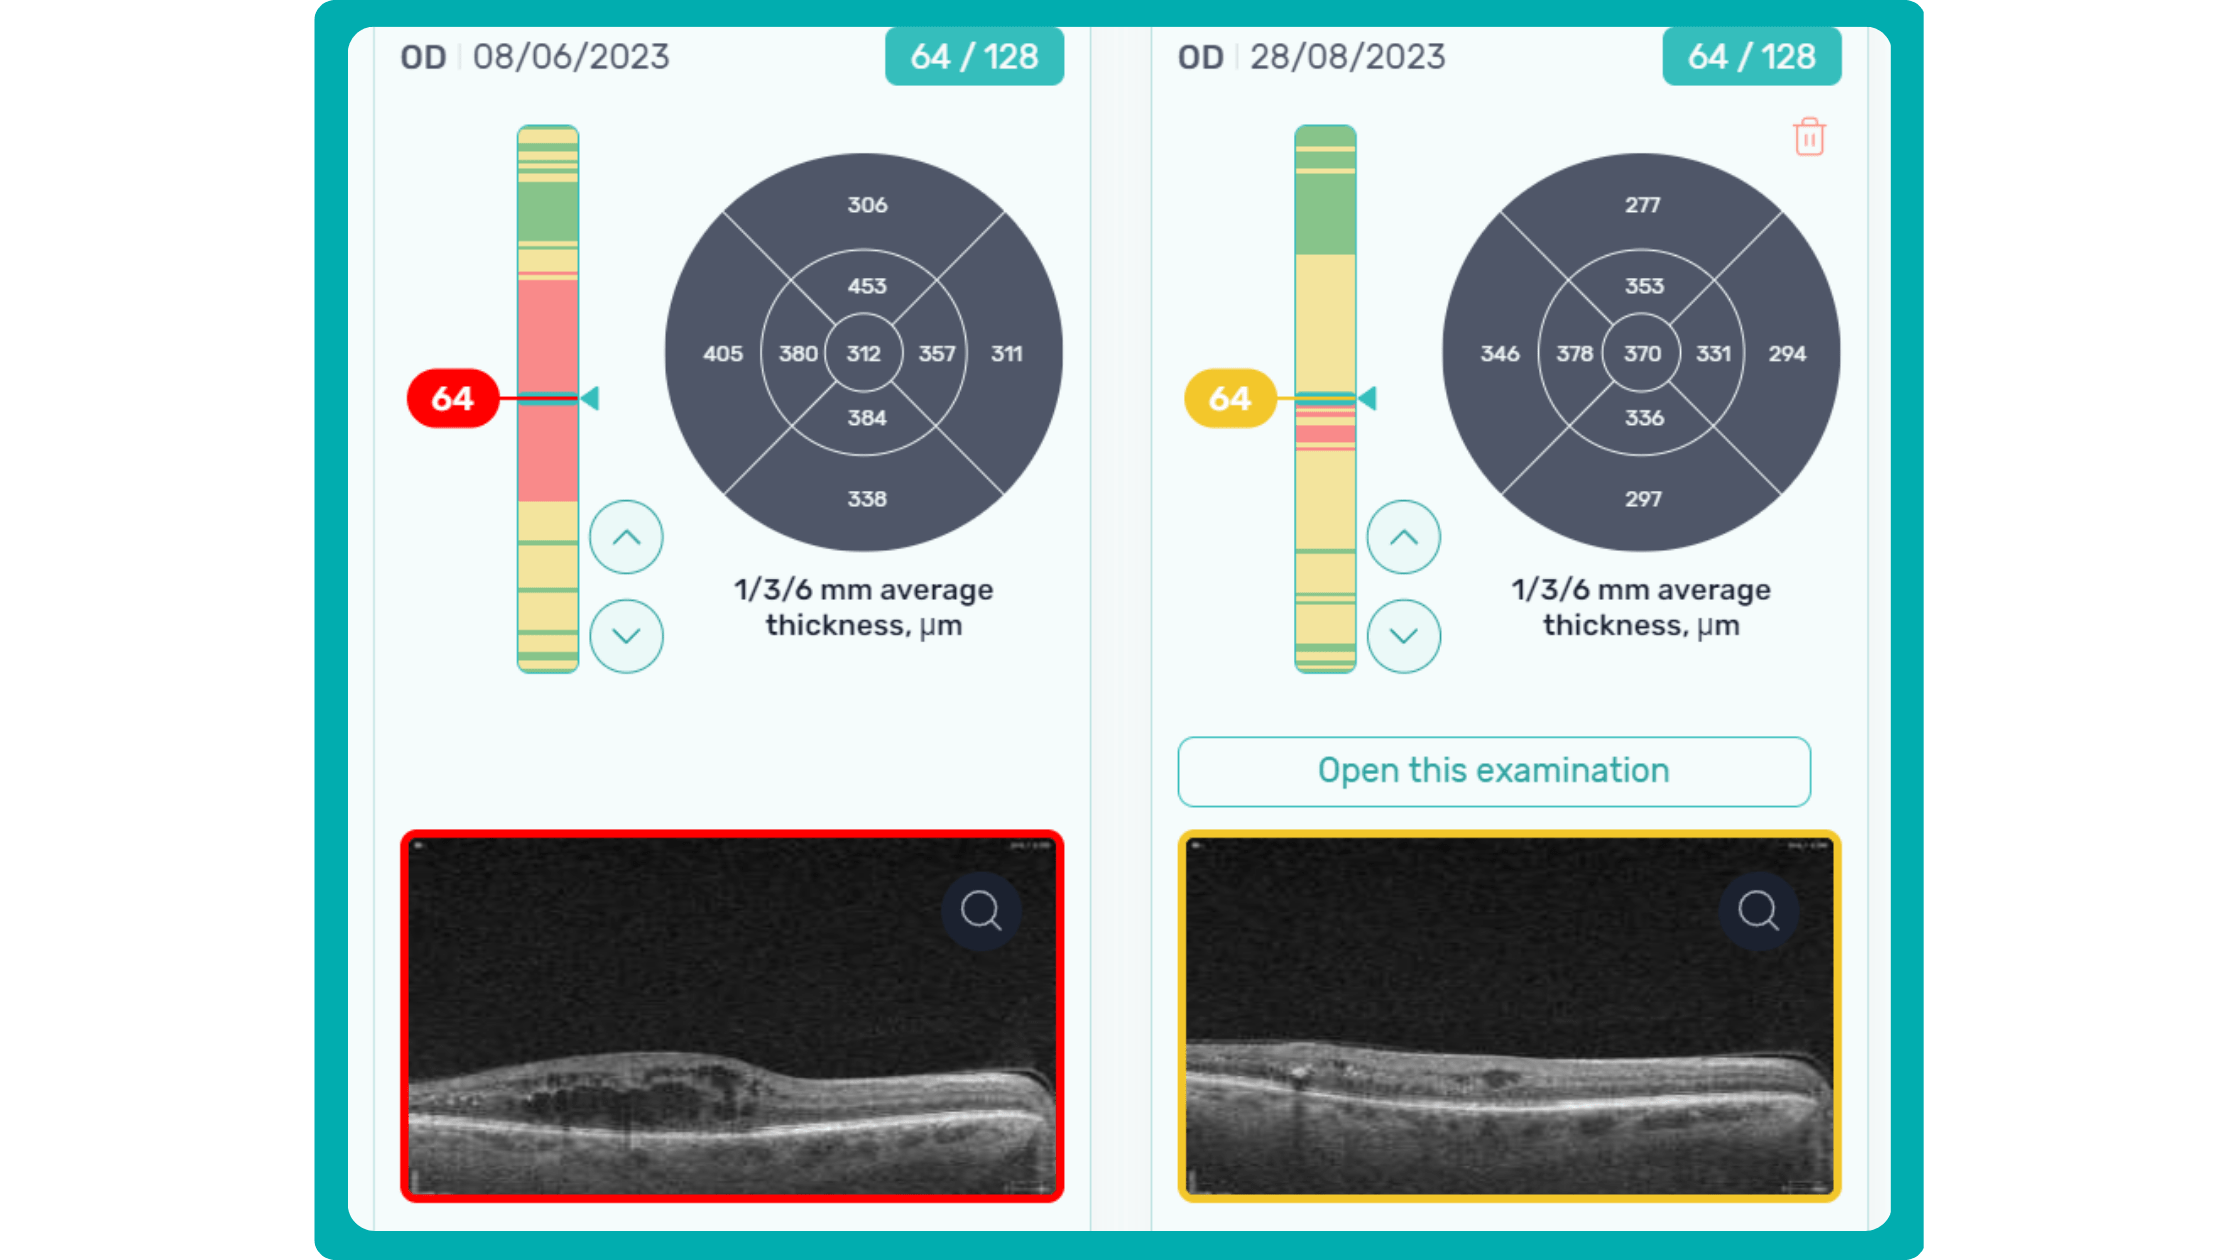
The B-scan offers a visual snapshot of foveal architecture and confirms proper scan centering. The quantitative thickness map employs the ETDRS sector map to measure retinal thickness within a 6mm circle around the fovea, with specific measurements for the foveal sector (1mm), inner macular ring (3mm), and outer macular ring (6mm).
Progression analytics enable comparison of serial macular scans, which is invaluable for managing vitreomacular interface disorders and macular edema. The semi-quantitative thickness map provides a broader overview of retinal thickness throughout the scan.
Given this amount of data, it is challenging to identify subtle and localized retinal pathological changes. As a result, entire OCT datasets are represented by few aggregated values, and the standard OCT reports generated by most devices often rely on significant data reduction to simplify interpretation, which you can usually not customize.
OCT report interpretation: 3 methods exist for displaying OCT data
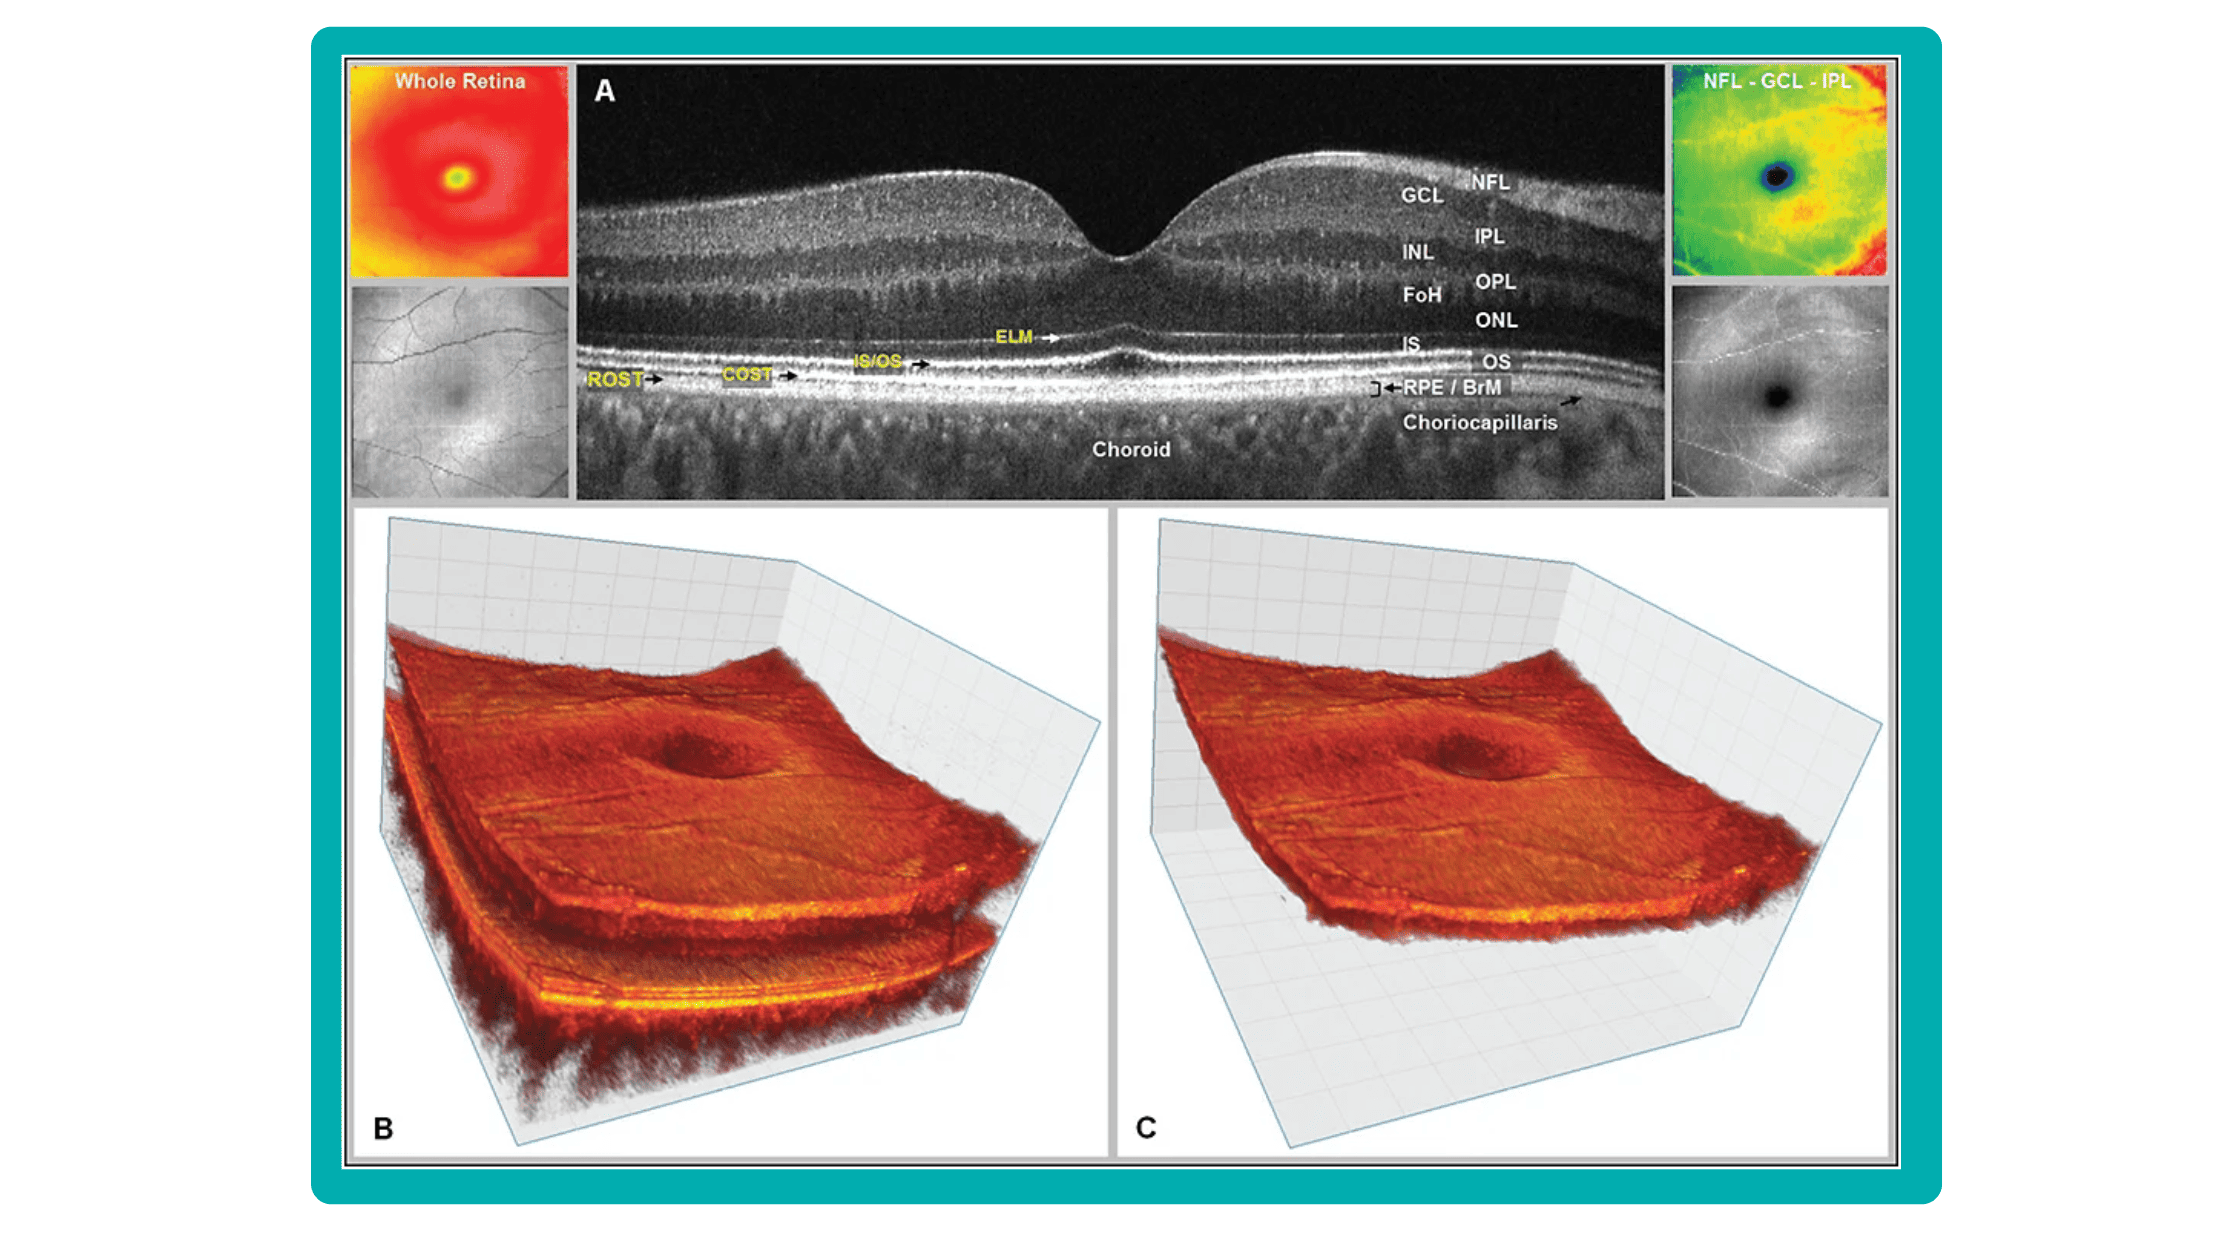
Firstly, acquired 2D image slices are presented individually. This allows for detailed examination, but navigating through numerous images can be cumbersome, particularly with large datasets.
Secondly, a fundus image is displayed with superimposed retinal layers. This facilitates linking layers to the fundus, but only one layer can be examined at a time, hindering the analysis of multiple layers simultaneously.
Thirdly, the OCT tomogram is visualized in 3D, providing a comprehensive overview, but adjusting the visual representation often has limitations. Additionally, combined 3D visualizations of the tomogram and layers are typically unavailable, potentially obscuring spatial relationships.
While existing reports offer diverse approaches to managing, analyzing, and presenting OCT data, each solution focuses on specific aspects and lacks customization. The situation becomes even more complex if scans come from different OCT devices, as manufacturers only provide software for the data for proprietary OCT scanners. Consequently, no approved way of viewing, analyzing, or comparing data from different manufacturers exists.
Furthermore, there are limited possibilities for implementing prototypes to perform such tasks since software libraries are provided with exclusive licenses and incomplete data specifications. Hence, managing and analyzing OCT data and relating them to other information are challenging and time-consuming tasks.
Often, supplementary software is utilized to overcome these limitations by providing additional information, visualizing and emphasizing data differently, and enabling the selection of relevant subsets.
How can customized reports for OCT help?
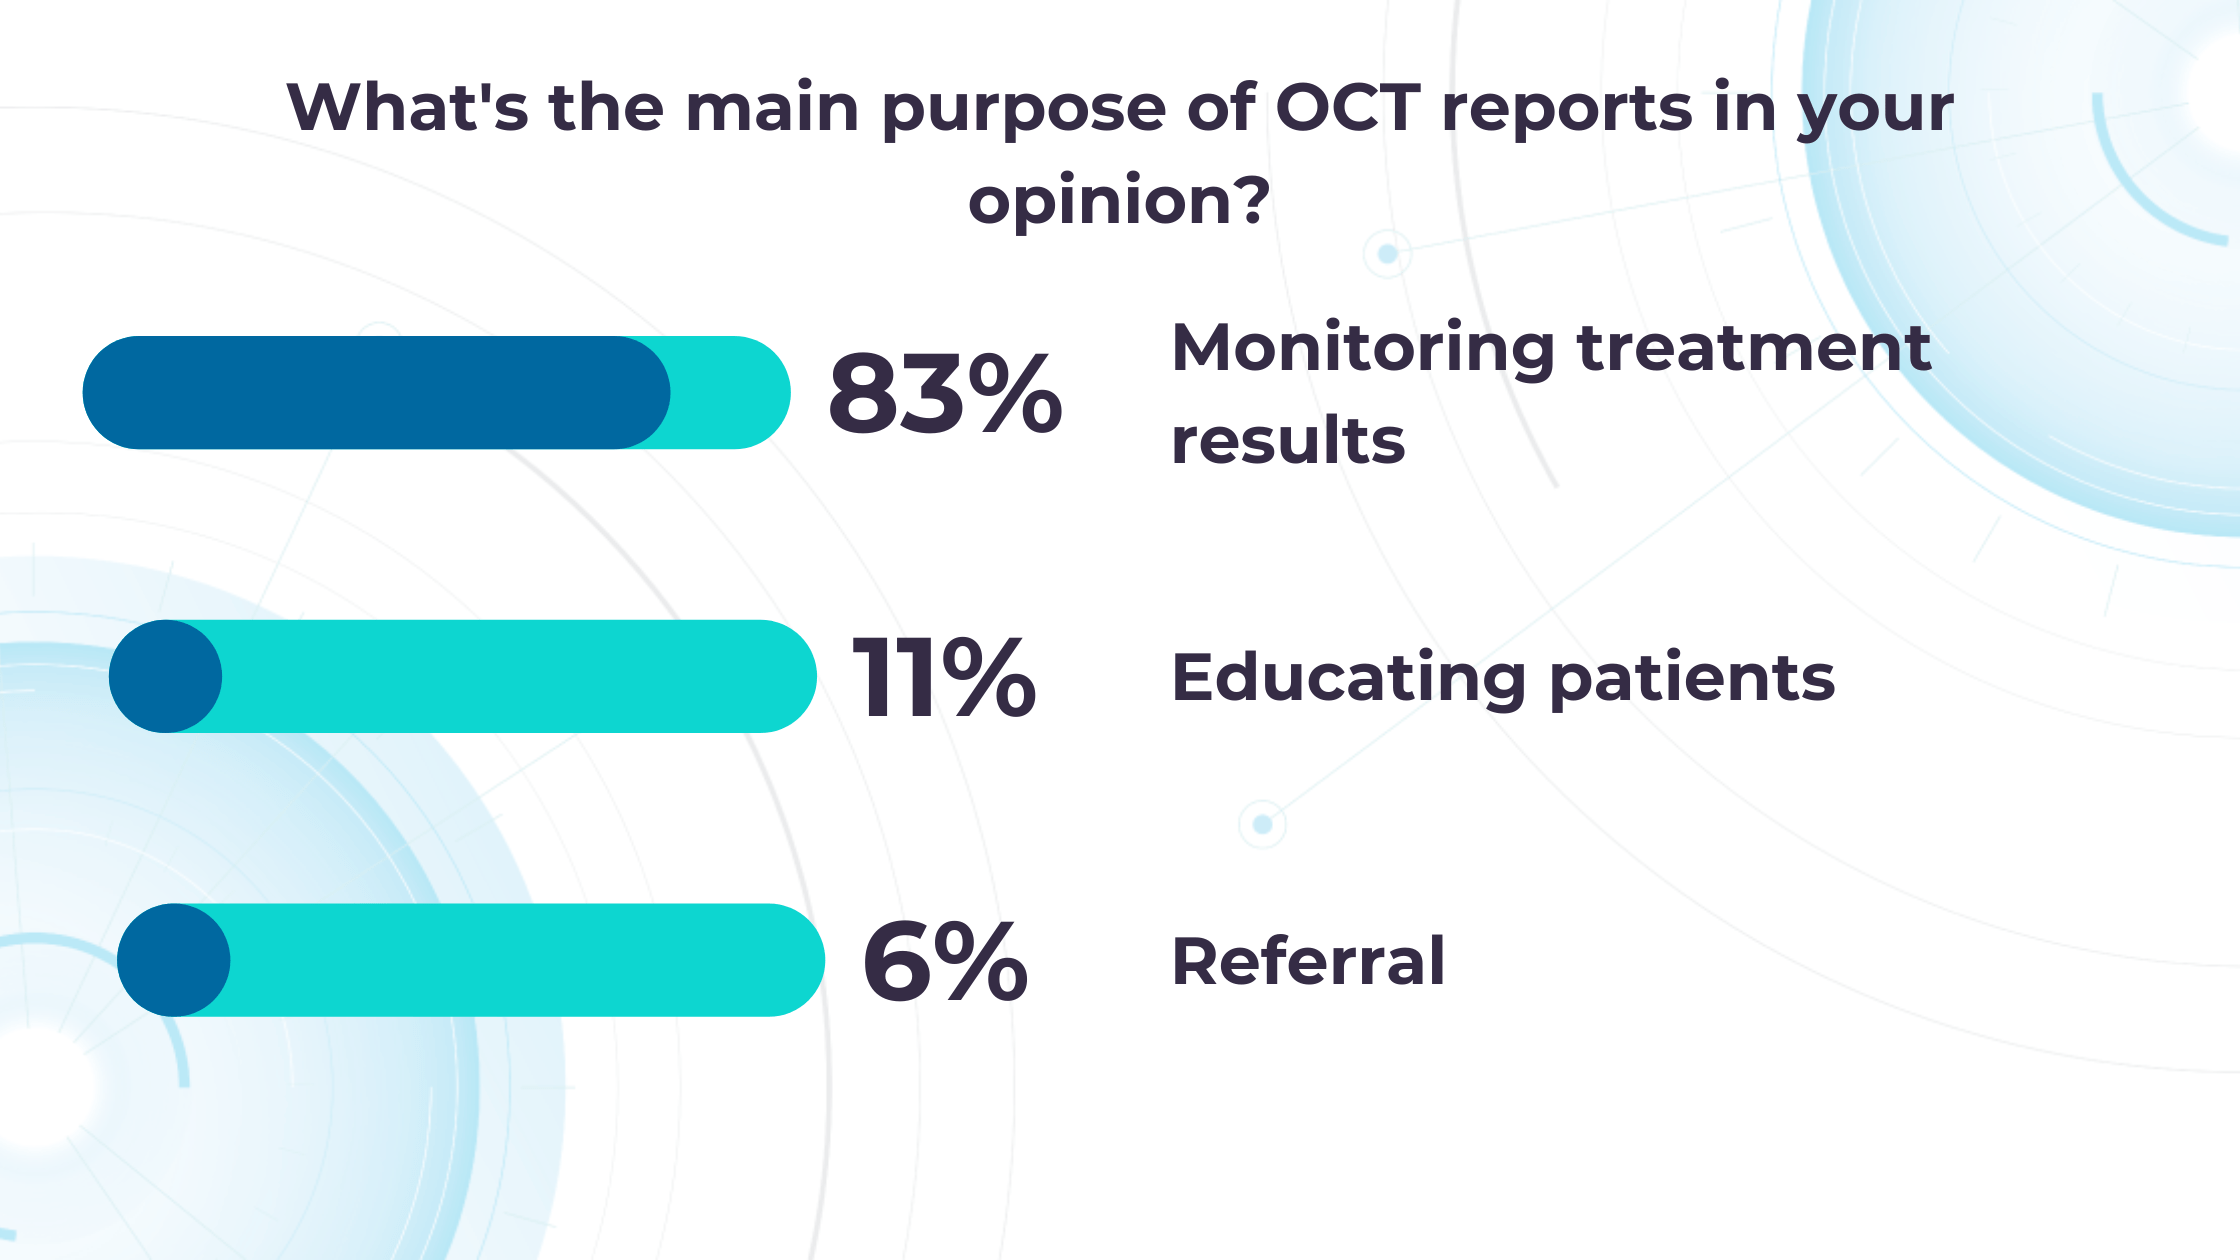
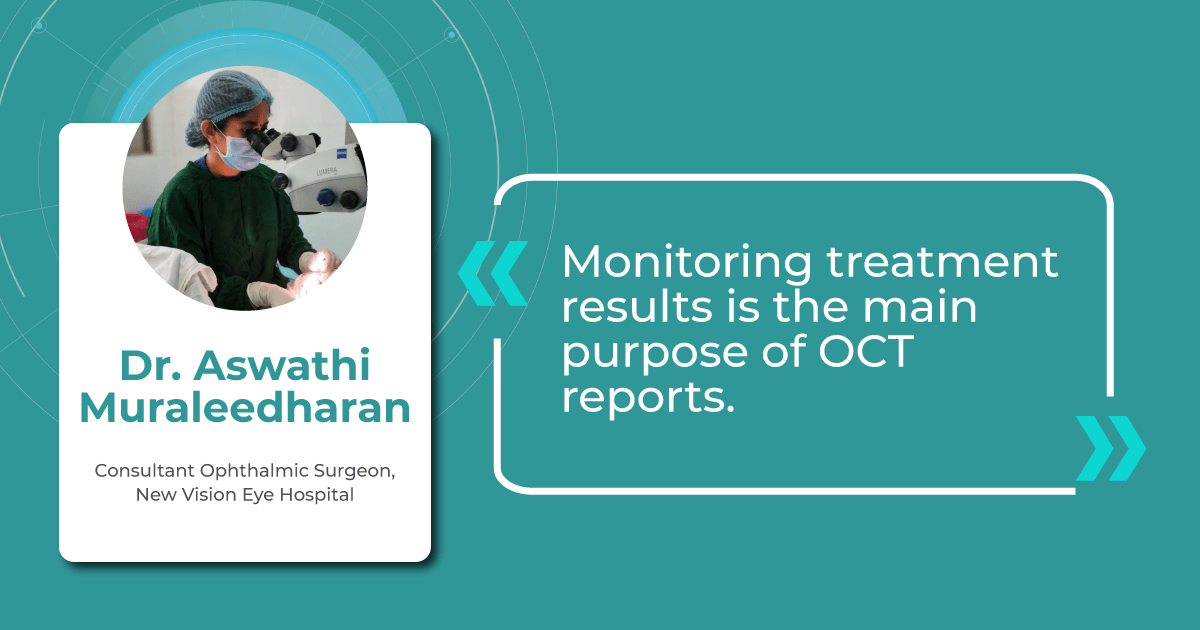
Altris AI’s recent survey has revealed that the key benefits of OCT technology for eye care specialists lie in treatment monitoring, patient education, and referral optimization.
-
Measuring treatment progress: biomarkers tracking, pathology progression
Imaging biomarkers are a particularly attractive option for clinical practice due to their non-invasive and real-time nature. Quantitative measurements of retinal thickness, fluid volume, and other biomarkers relevant to diseases like diabetic retinopathy and age-related macular degeneration aid in treatment monitoring.
OCT reports with customized measurements and selected biomarkers, retinal layers, or segments allow for precise focus on treatment monitoring and patient response to therapy. This personalized approach enhances clinical decision-making by highlighting each case’s most relevant information.
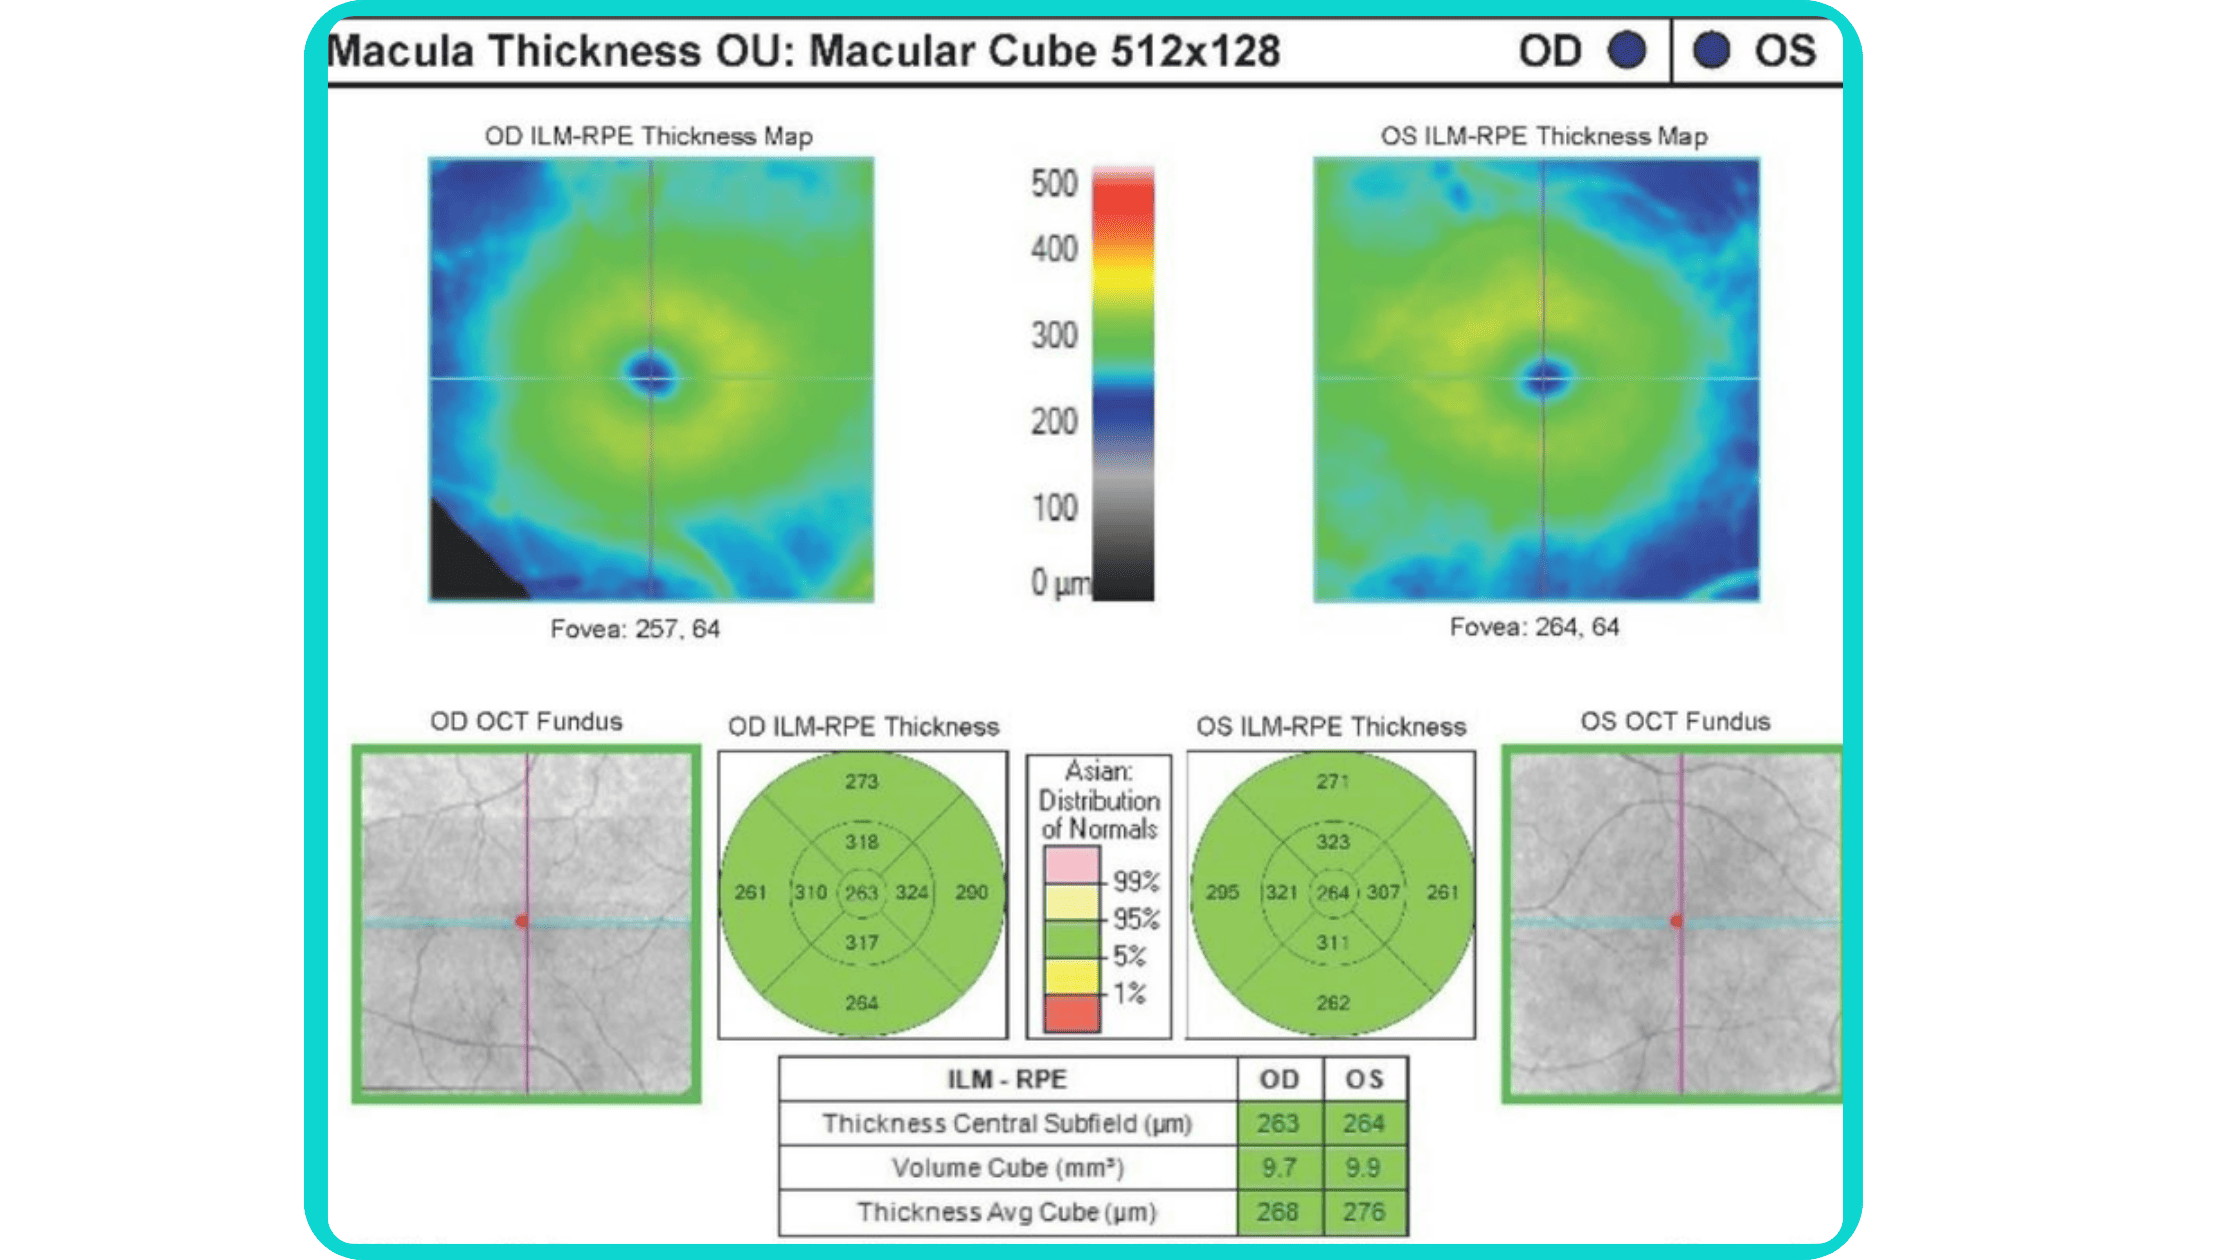
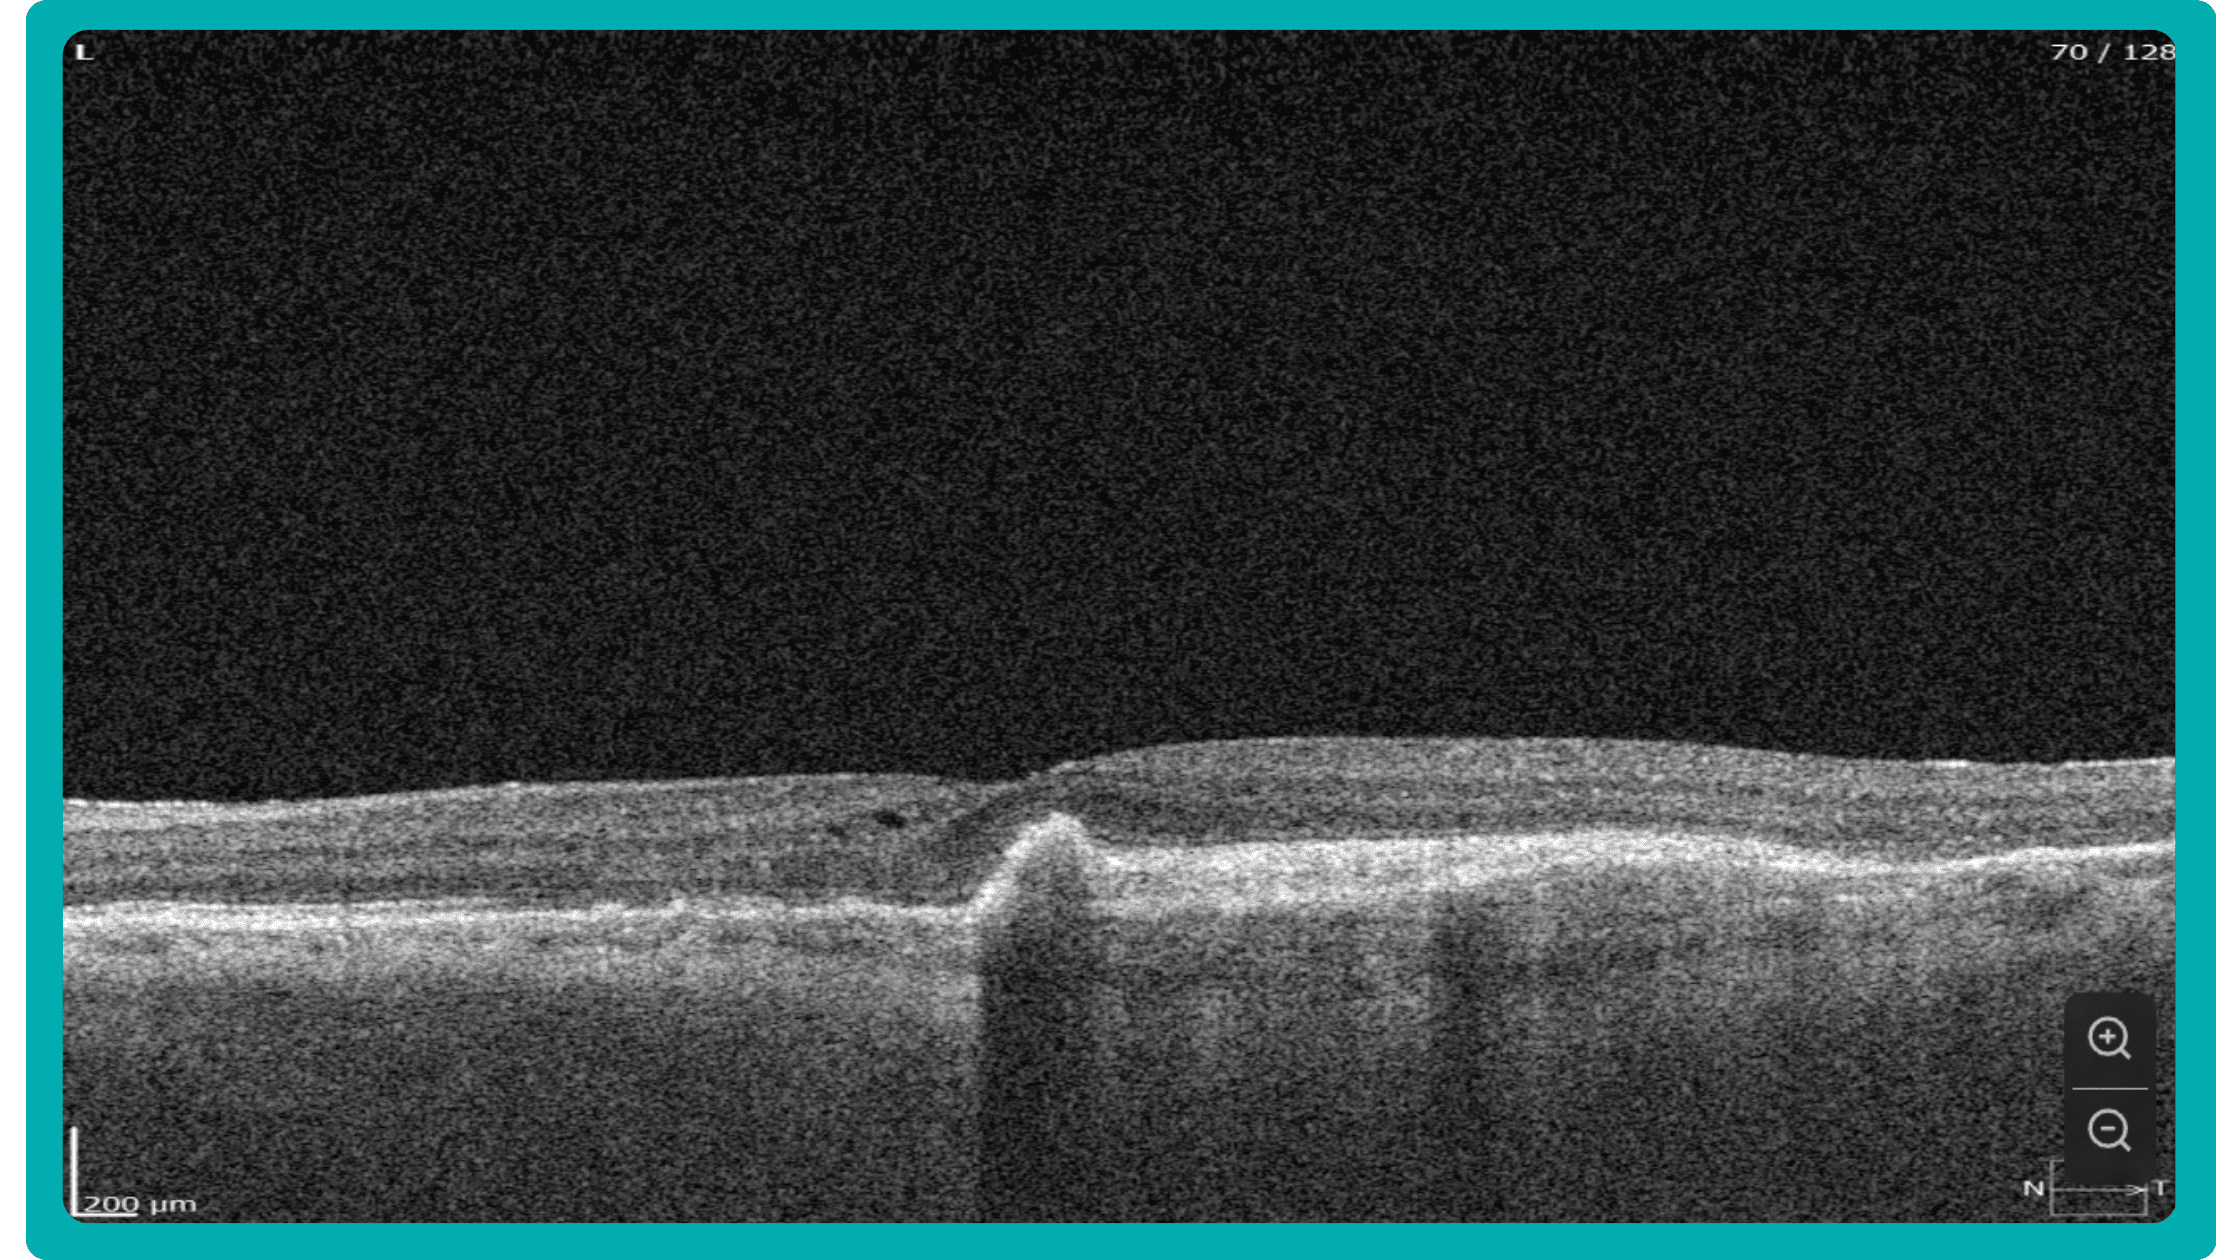
In current clinical practice, macular damage assessment typically involves measuring the distance between the ILM and RPE layers, summarized in a post-scan report.
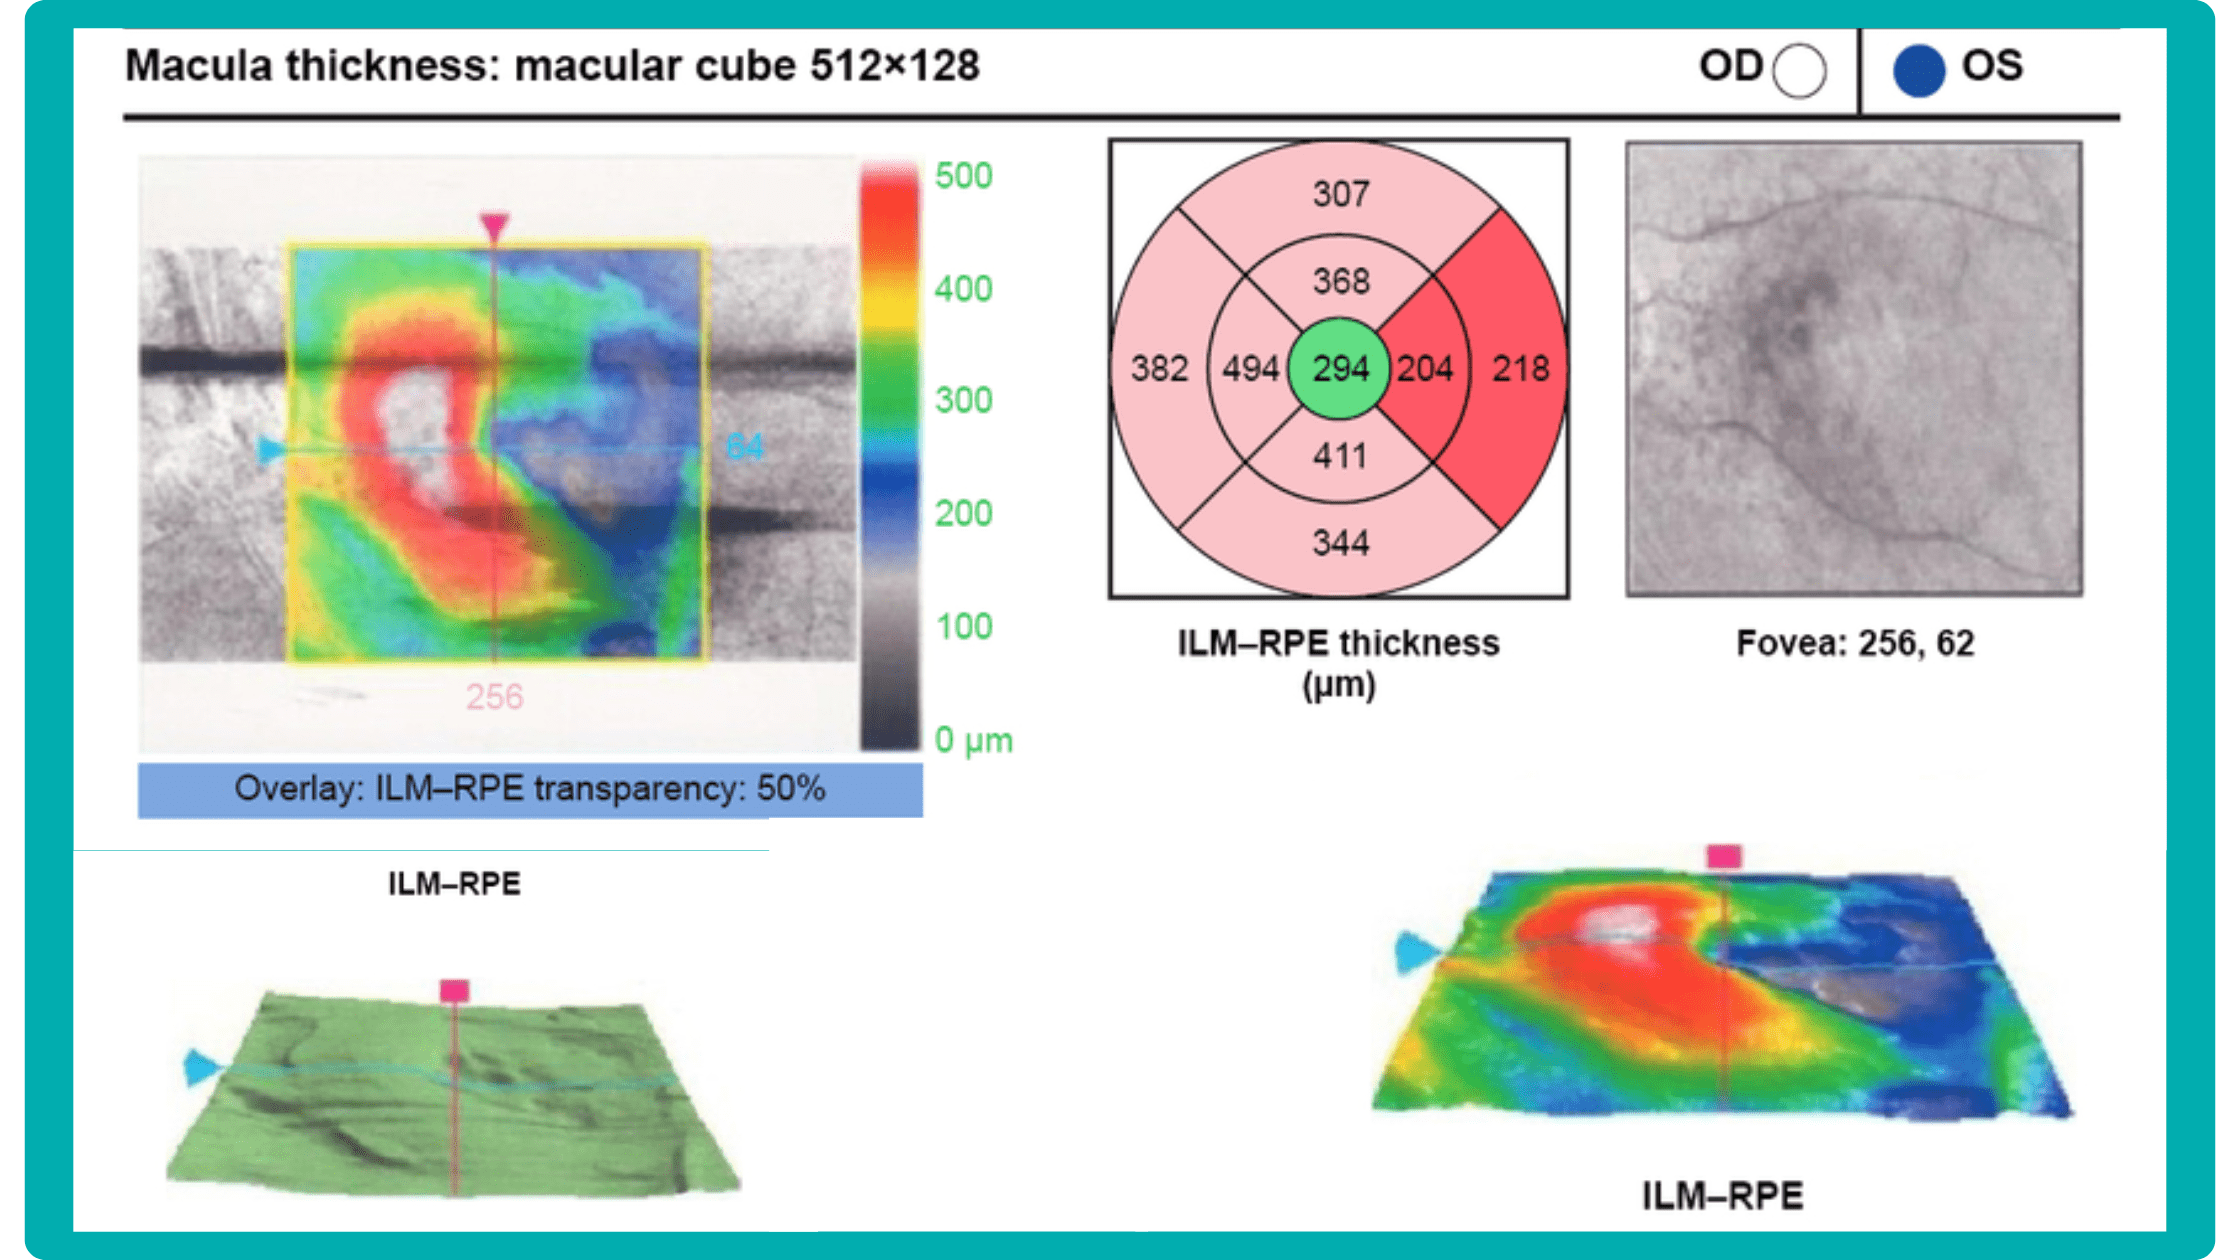
However, these reports often fall short of visualization best practices, employing ineffective or inconsistent color schemes. Additionally, they lack flexibility, with static visuals preventing in-depth examination of specific details. Despite these limitations, these reports remain valuable for many clinicians by distilling complex data into a manageable format.
Enhanced OCT data visualization offers a promising solution to these challenges. It enhances report clarity and comprehensibility while preserving the richness of the underlying data.
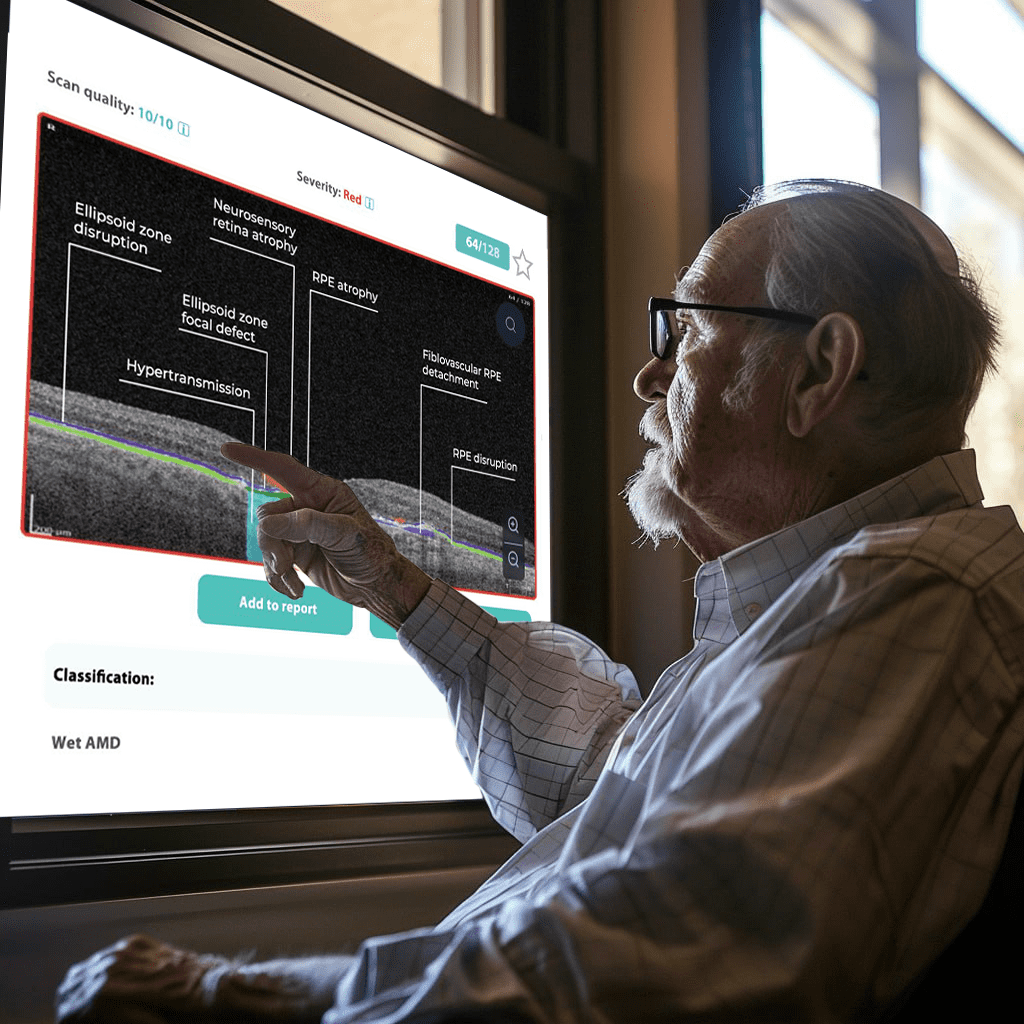
Let’s explore how this applies to a clinical case, such as monitoring a patient with Wet AMD during follow-up visits.
Data demonstrates that OCT findings can reveal the onset or progression of neovascular AMD before a patient reports new symptoms or changes in visual acuity. In fact, OCT images are reported to have the best diagnostic accuracy in monitoring nAMD disease states. This underscores the importance of key OCT findings or biomarkers in personalizing anti-VEGF treatment, achieving disease control, and reducing monitoring burdens.
Central Retinal Thickness emerged as one of the earliest OCT biomarkers used as an outcome measure in clinical trials for nAMD.
However, due to confounding factors, CRT’s use in outcome-based assessments of nAMD varies. Thus, it is essential to evaluate additional morphological changes alongside retinal thickness and their relationships with functional outcomes.
It has been reported that OCT images have the best diagnostic accuracy in monitoring nAMD disease states.
Another finding that is correlated with a worsening VA due to the associated photoreceptor defects is any damage to the four outer retina layers, including the RPE, interdigitation zone (IZ), ellipsoid zone (EZ), and external limiting membrane band (ELM).
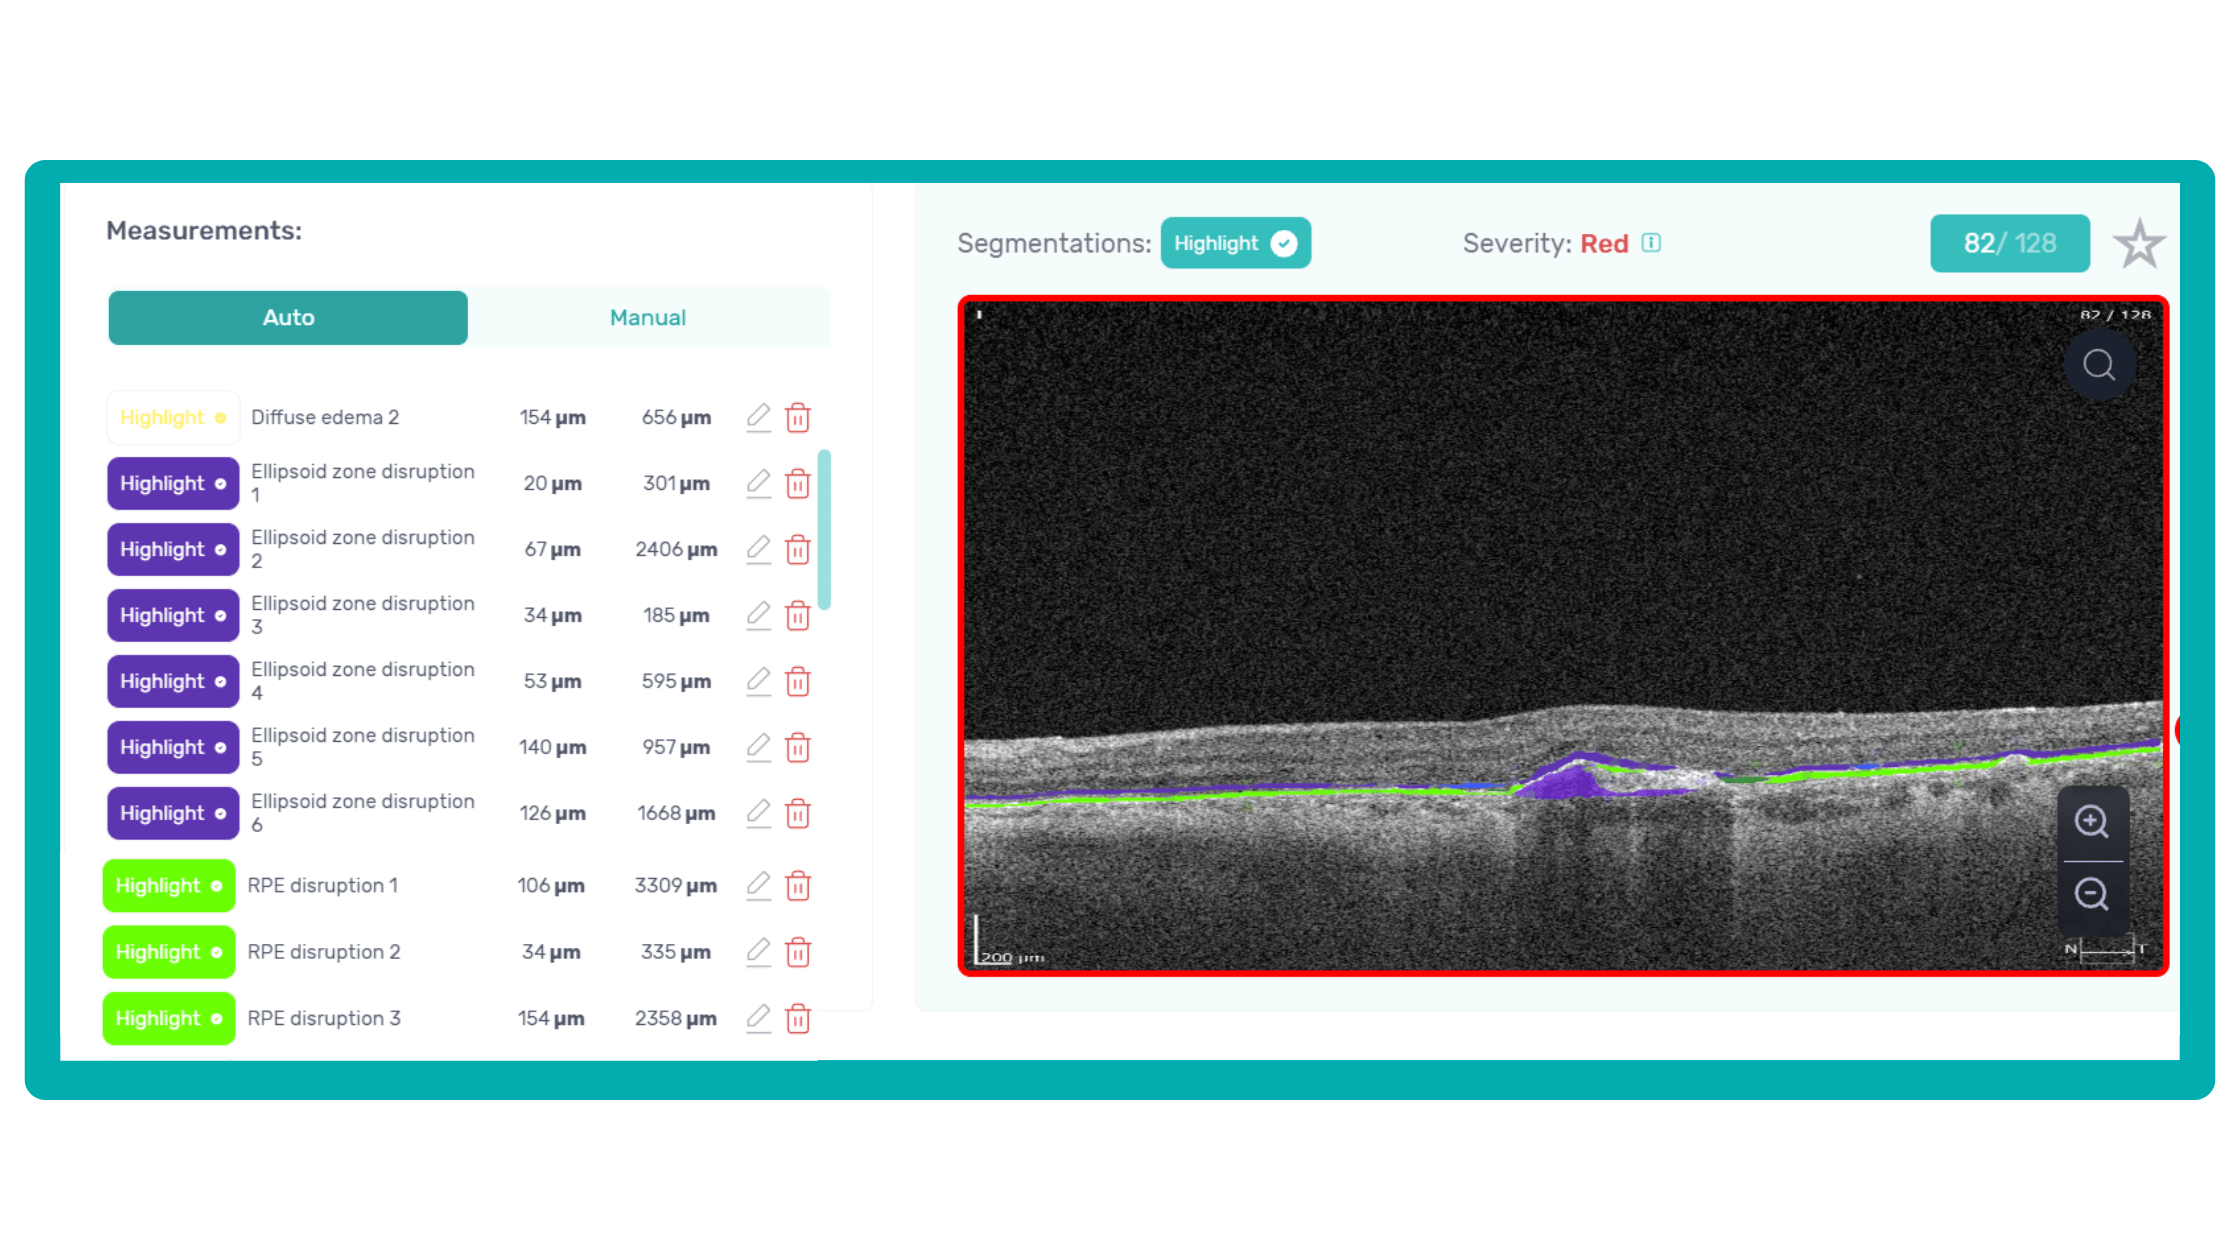
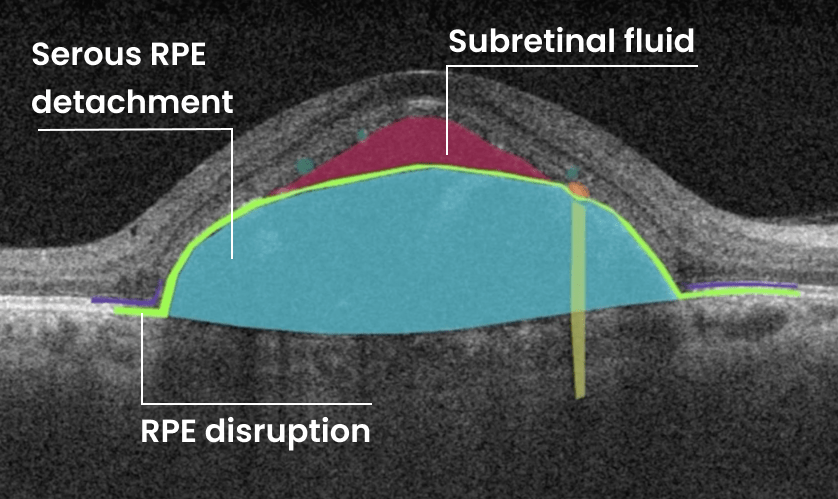
OCT is a valuable imaging tool for visualizing subretinal hyperreflective material (SHRM). It can automatically identify and quantify SHRM and fluid and pigment epithelial detachment to calculate the overall risk of worsening visual outcomes associated with SHRM.
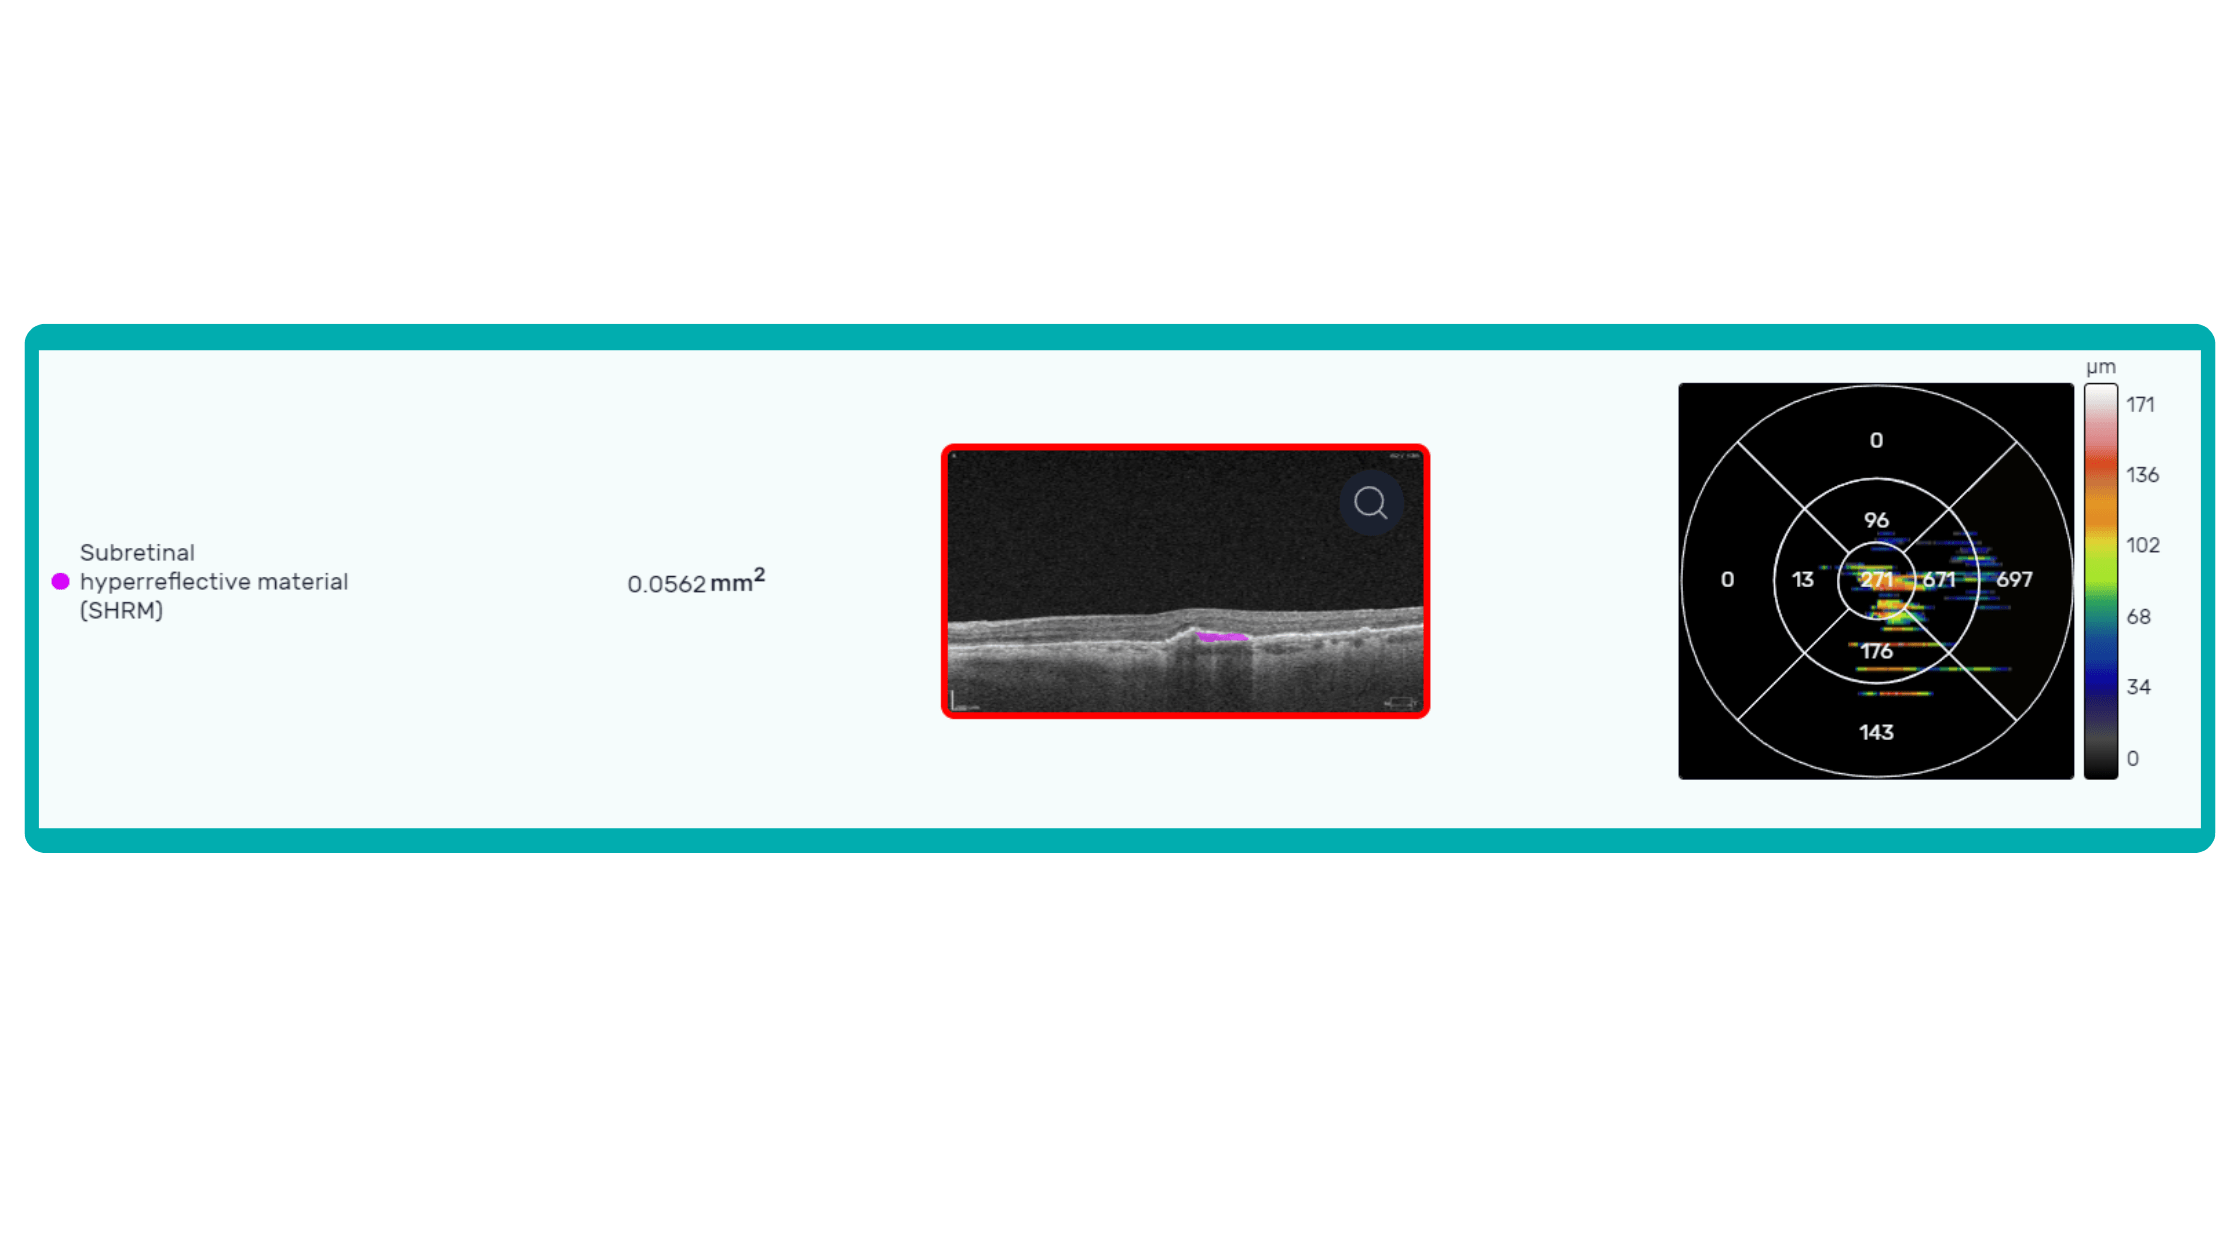
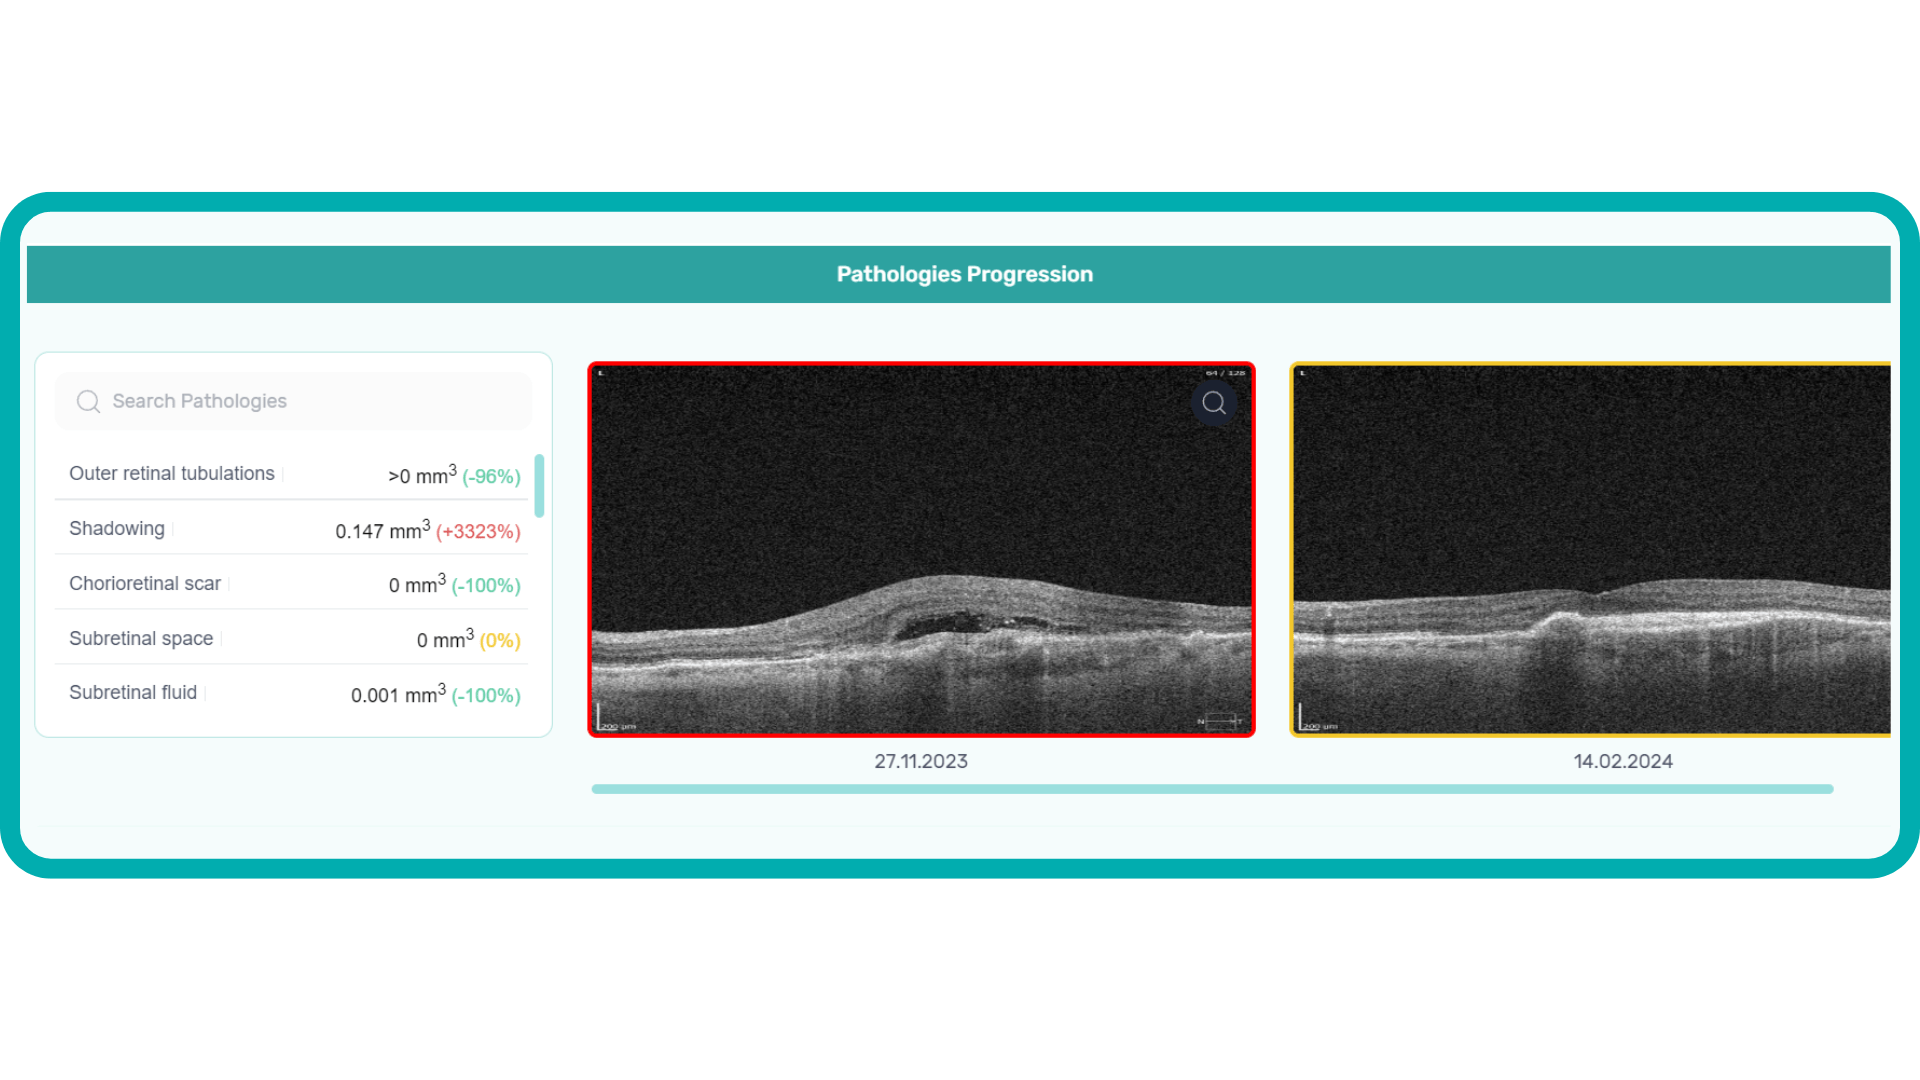
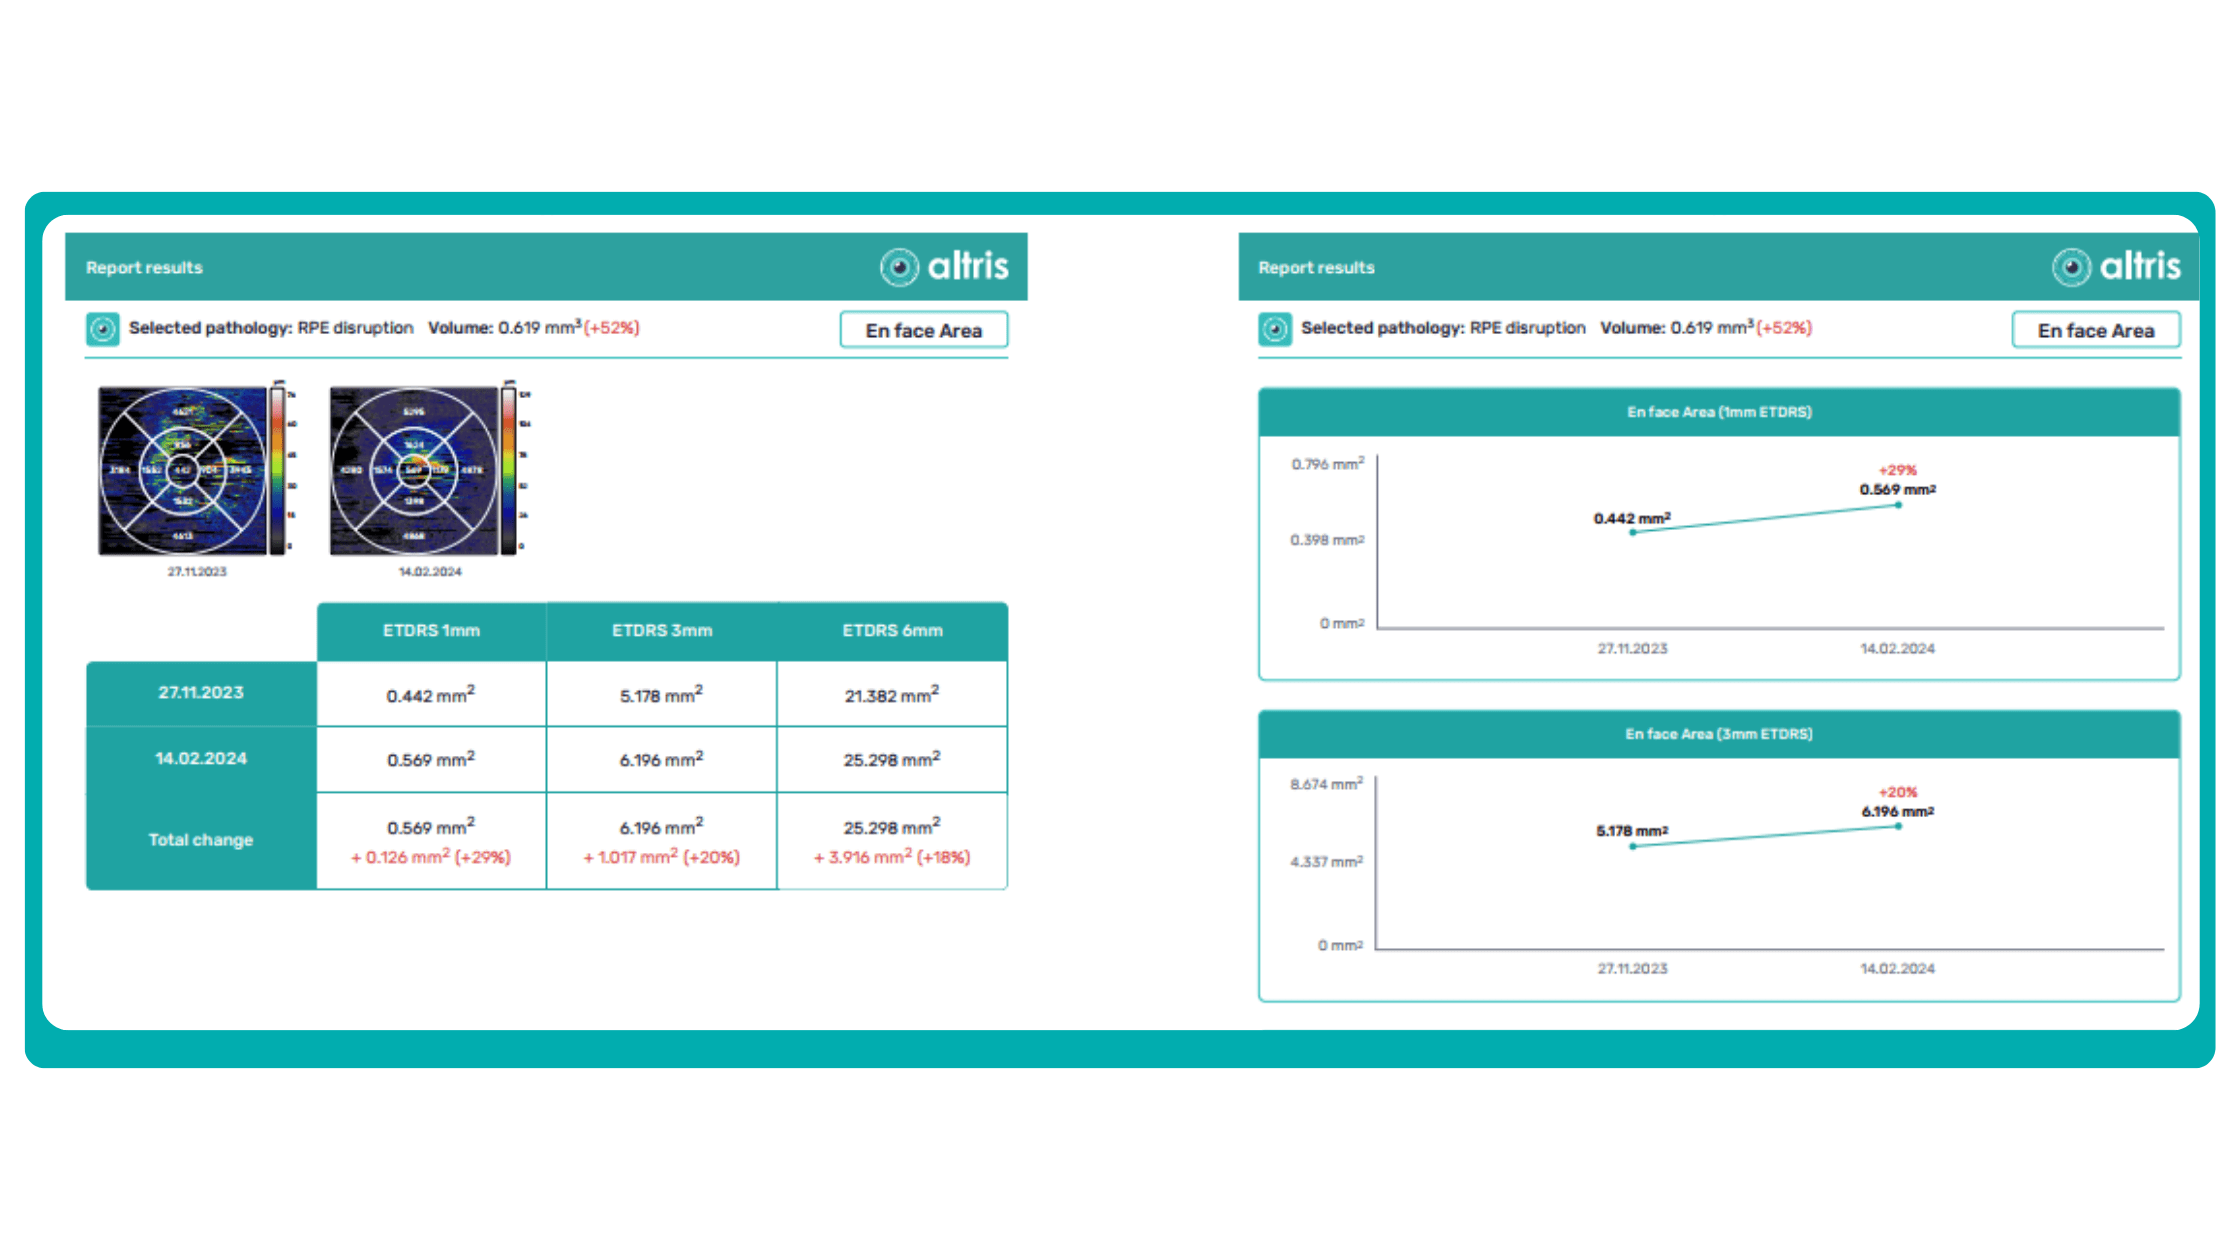
Subsequent follow-up visits will then display the most relevant picture, highlighting the most pertinent biomarkers for tracking a particular pathology (wet AMD in our example) and comparing their volume, progression, or regression through visits.
Another helpful option is retinal layer segmentation, which focuses solely on the retinal layers of interest for the specific case.
This level of customization empowers clinicians with a comprehensive yet targeted view of the patient’s condition. It saves time from manually detecting anomalies on scans and facilitates informed decision-making and personalized treatment plans.
-
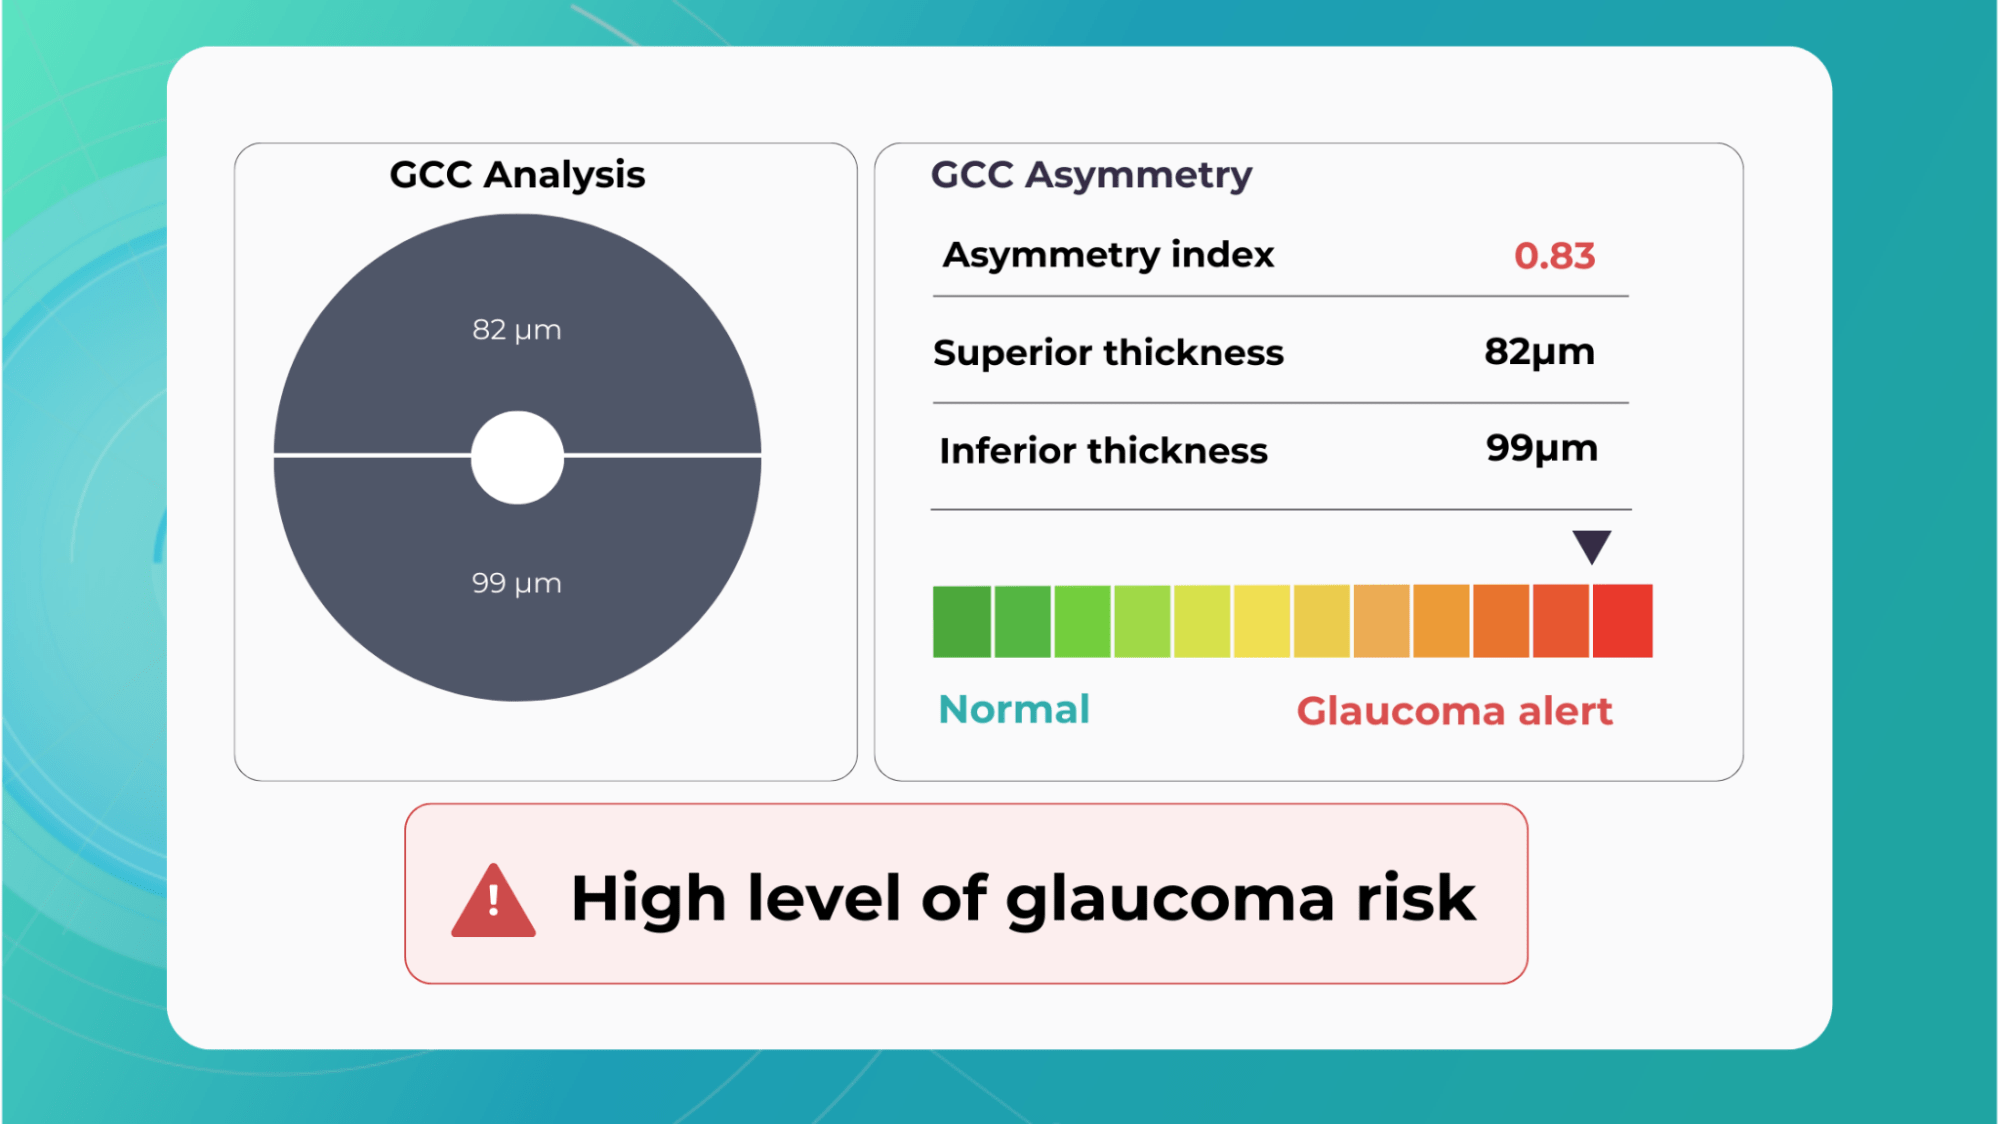
Glaucoma risk evaluation
Millions risk irreversible vision loss due to undiagnosed glaucoma, underscoring the need for improved early detection. Current tests often rely on observing changes over time, delaying treatment assessment and hindering early identification of rapid disease progression. OCT frequently detects microscopic damage to ganglion cells and thinning across these layers before changes are noticeable through other tests. However, the earliest signs on the scan can still be invisible to the human eye.
AI algorithms offer insights into glaucoma detection by routinely analyzing the ganglion cell complex, measuring its thickness, and identifying any thinning or asymmetry to determine a patient’s glaucoma risk without additional clinician effort.
Another significant benefit of AI systems is that OCT for glaucoma usually utilizes a normative database to assess retinal normality. However, these databases are limited in size and represent an average of a select group of people, potentially missing early glaucoma development in those who deviate from the “norm.” Conversely, individuals may be unnecessarily referred for treatment due to not fitting the “normal” profile, even if their eyes are healthy.
-
Crafting effective referral
In the UK, optometrists are crucial in initiating referrals to hospital eye services (HES), with 72% originating from primary care optometric examinations. While optometrists generally demonstrate proficiency in identifying conditions like cataracts and glaucoma, discrepancies in referral thresholds and unfamiliarity with less common pathologies can lead to unnecessary or delayed referrals.
At the same time, an evaluation of incoming letters from optometrists in a glaucoma service found that 43% of the letters were considered “failures” because they did not convey the necessity and urgency of the referral.
So, having an elaborate record of the entire clinical examination in addition to a referral letter is crucial.
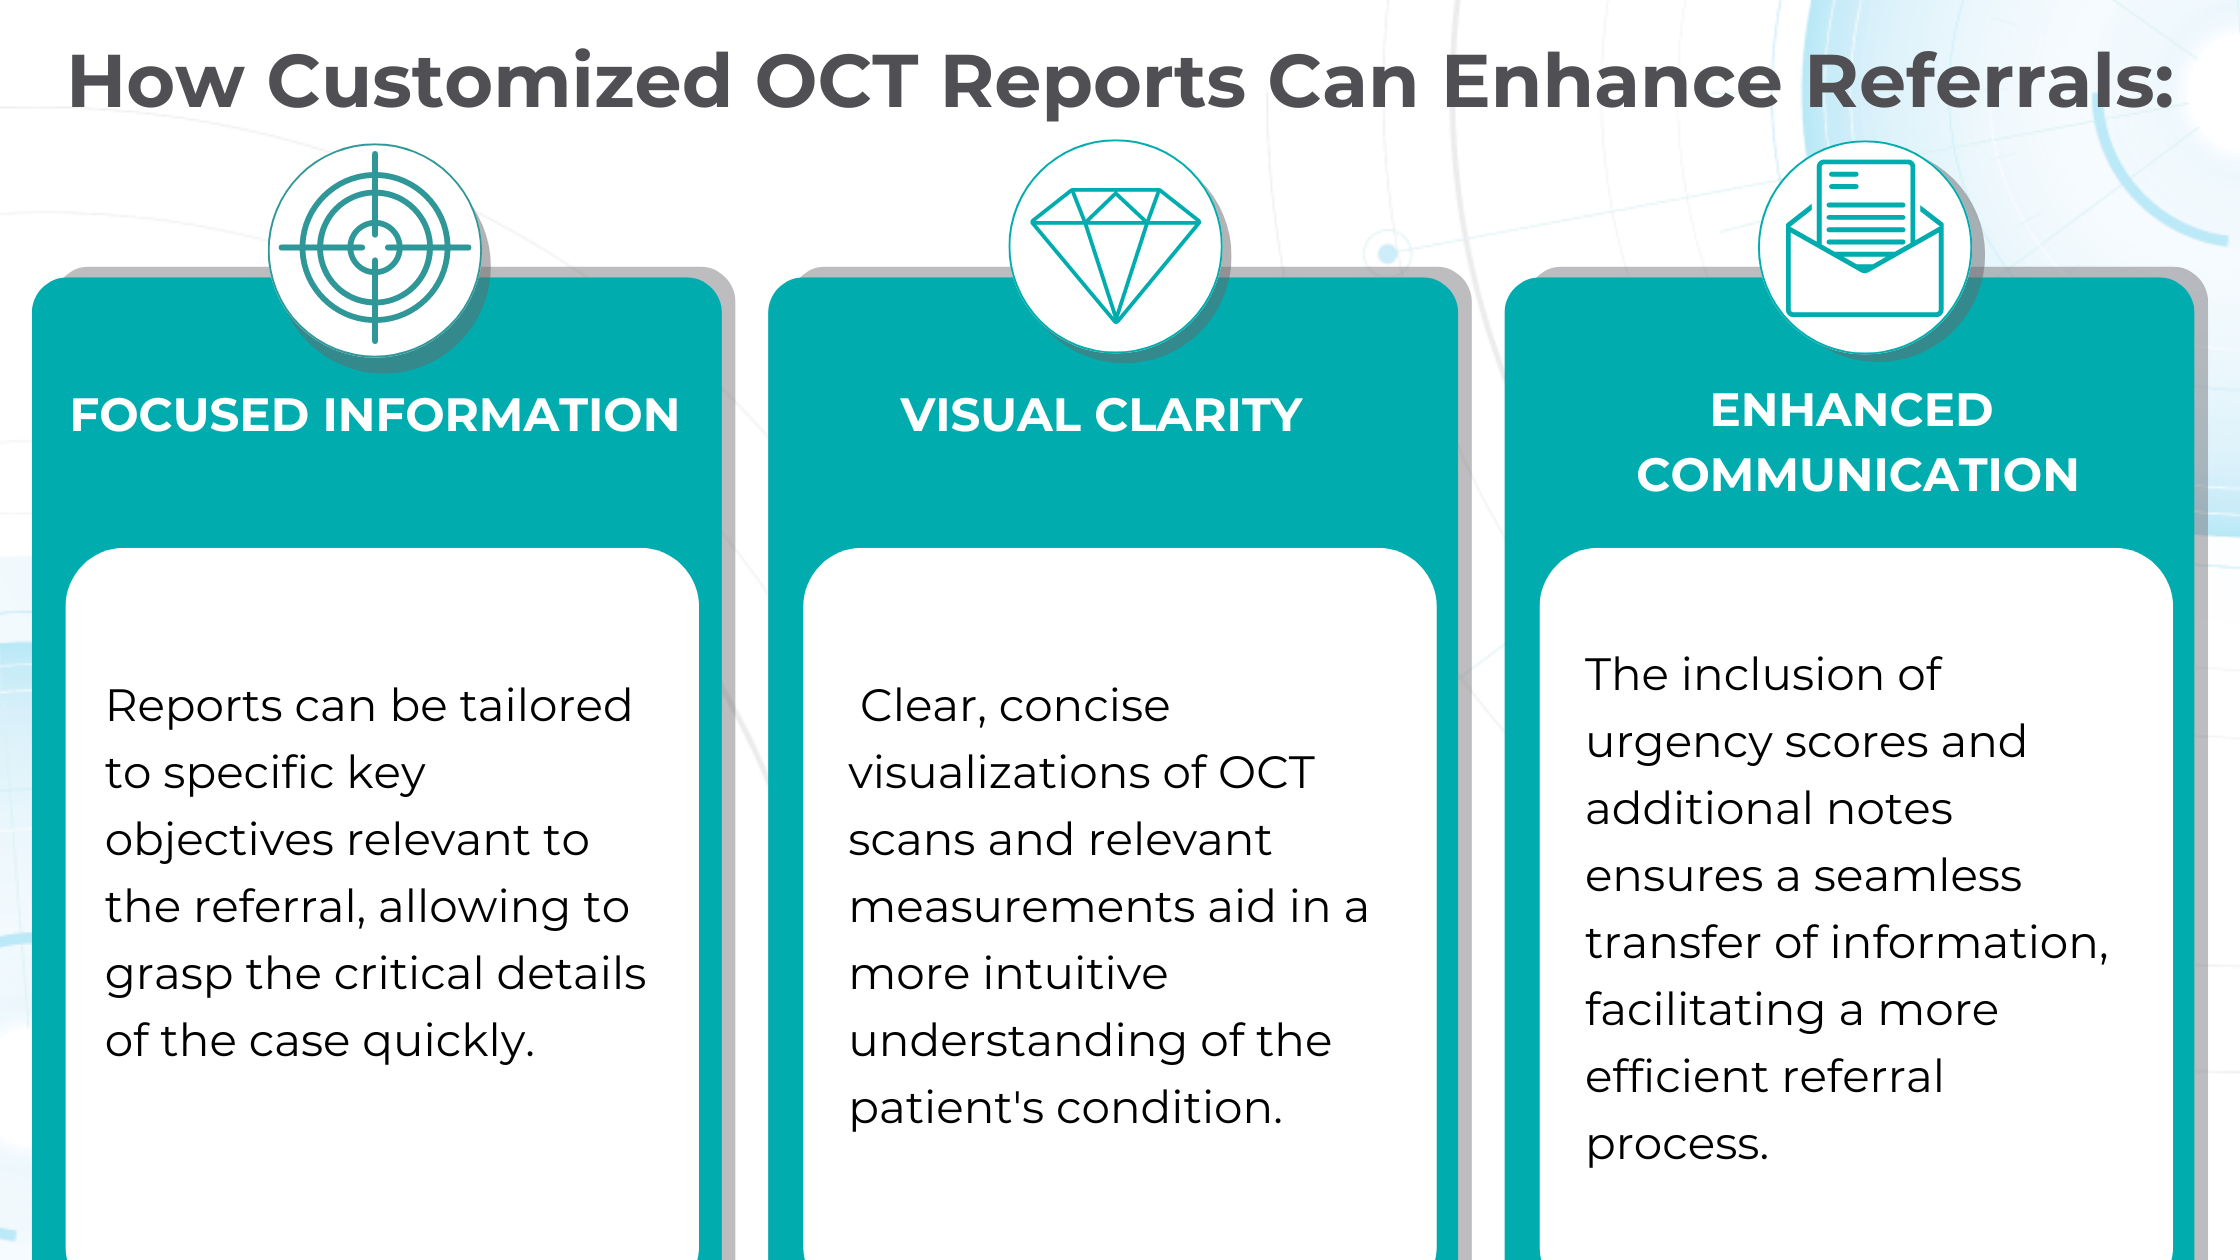
Customized OCT reports solve this challenge by streamlining the referral process and improving communication between optometrists and ophthalmologists. These reports can significantly reduce delays and ensure patients receive timely care by providing comprehensive and relevant information upfront.
-
Patient Education
Patient education and involvement in decision-making are vital for every medical field and crucial for ophthalmology, where insufficient patient engagement can lead to irreversible blindness.
Research specifically targeting the ophthalmology patient population, which often includes older and potentially visually impaired individuals, reveals a clear preference for materials their eye care provider endorsed.

Providing explicit visual representations of diagnoses can significantly improve patient understanding and compliance. Seeing photos of their condition, like glaucoma progression, builds trust and reinforces the importance of treatment recommendations.
Surveying eye care professionals specializing in dry eye disease revealed a strong emphasis on visual aids during patient education.
Photodocumentation is a favored tool for demonstrating the condition to asymptomatic patients, tracking progress, and highlighting treatment’s positive outcomes.
The visual approach provides tangible evidence of the benefits of their treatment investment, allowing for a deeper understanding of the “why” behind treatment recommendations and paving the way for ongoing collaboration with the patient.

Color-coded OCT reports for pathologies and their signs, severity grading, and pathology progression over time within its OCT analysis highlight the littlest bits that a patient’s unprepared eye would miss otherwise. With follow-up visits, patients can see what’s happening within their eyes and track the progress of any conditions during treatment.
-
Updating EMR and Audit readiness
OCT reports are crucial components of a patient’s medical history and are essential for accurate diagnosis, personalized treatment, and ongoing monitoring. The streamlined process of integrating OCT data into EMR ensures that every eye scan, with its corresponding measurements, biomarkers, and visualizations, becomes an easily accessible part of the patient’s medical history.
This is crucial for continuity of care and simplifies the audit process, providing a clear and comprehensive record of the patient’s eye health over time. Just optometry chains alone can perform an imposing volume of OCT scans, with some reaching upwards of 40,000 per week. While this demonstrates the widespread adoption of this valuable diagnostic tool, it also presents a challenge: the increased risk of missing subtle or early-stage pathologies amidst the sheer volume of data.
Enhanced OCT reports offer a solution by providing a crucial “second look” at scan results. While not foolproof, this double-check significantly reduces the risk of overlooking abnormalities, ultimately improving patient outcomes and safeguarding the clinic’s reputation.
In audits, comprehensive OCT reports are critical in ensuring regulatory compliance. As the Fundamentals of Ophthalmic Coding states, “It is the responsibility of each physician to document the interpretations as promptly as possible and then communicate the findings with the patient… to develop a fail-safe way to ensure that your interpretations are completed promptly.”
Auditors typically look for several key elements in OCT reports:
- Physician’s Order: Document the test order, indicating which eye(s) and the medical necessity.
- Interpretation and Report: The physician analyzes the scan results, including any identified abnormalities or concerns.
- Timely Completion: Prompt documentation and communication of findings to the patient.
Customisable OCT reports can streamline this process by generating comprehensive reports that meet these requirements. These reports include detailed measurements, biomarker analysis, and clear visualizations, making it easier for physicians to review, interpret, and document their findings efficiently.
FDA-cleared AI for OCT analysis
Summing up
Standard OCT reports, while valuable, often need more customization due to data reduction and lack of customization. The inability to visualize multiple scans simultaneously or compare data from different devices hinders comprehensive analysis. Enhanced OCT reports address these limitations by offering detailed visualizations, customizable measurements, and biomarker tracking.
Customisable OCT reports aid in the early detection and monitoring of diseases like wet AMD and glaucoma, empowering clinicians with accurate diagnoses and personalized treatment plans. Additionally, they streamline referrals by providing focused information and clear visualizations, reducing delays and improving communication between optometrists and ophthalmologists.
These comprehensive reports also enhance patient education by offering clear visual representations of their conditions and treatment progress, fostering better understanding and compliance. Moreover, with detailed documentation and analysis, detailed reports ensure audit readiness for eye care professionals, mitigating the risk of missed pathologies and upholding regulatory compliance.