Reading time
14 min read
OCT Scan Normal Eye vs. 8 Most Common Pathologies
Differentiating between an OCT scan of a normal eye vs. a pathological one is a practical skill gained after years and years of practice. However, educating yourself on the basic differences will speed up the process. Understanding the “why” and “how” behind any changes on the OCT scan, compared to a normal macula OCT, will speed up your learning curve and deepen your expertise as a retinal expert.
The article’s first part focuses on key OCT features and their meaning as a structural change for retinal architecture. The second part discusses the most recognizable OCT features of eight common pathologies.
OCT Scan: Normal Eye
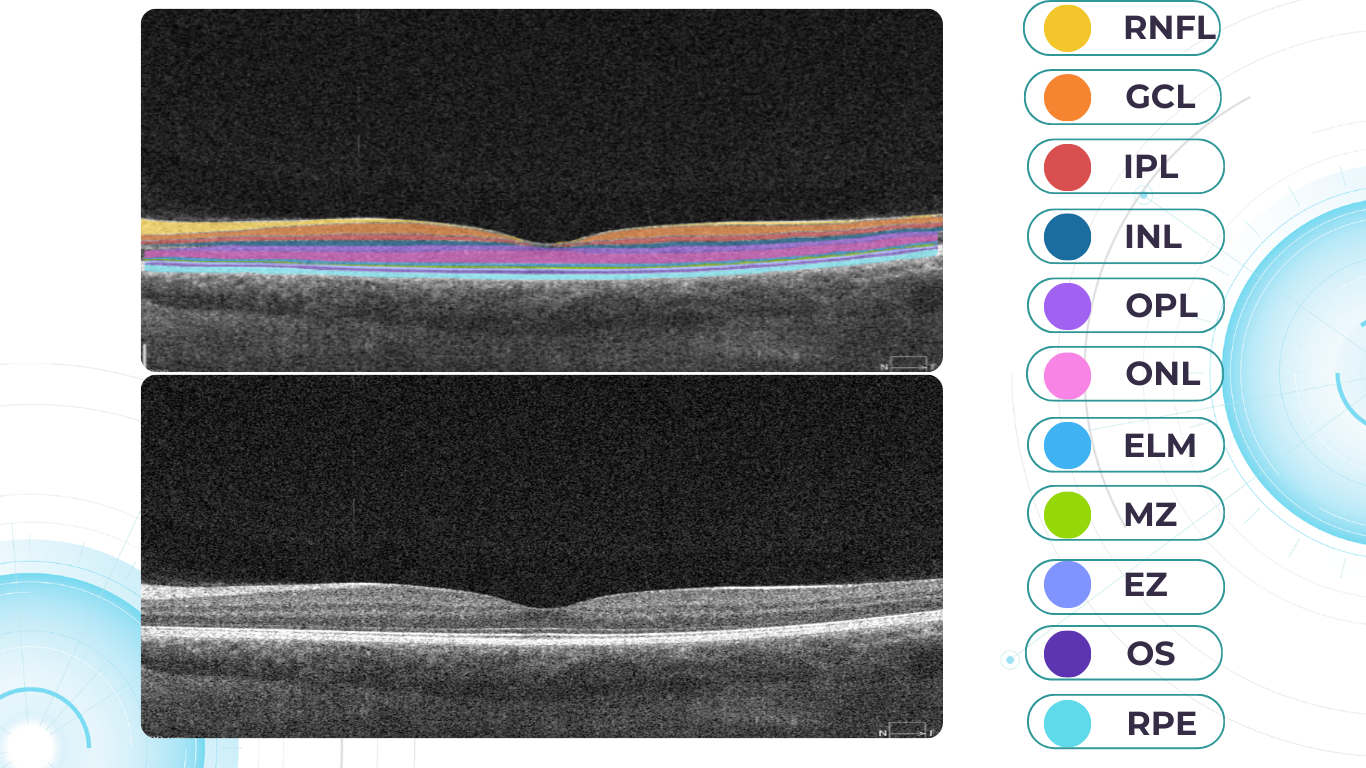
When evaluating an OCT scan, the most logical step is to understand how a normal macula OCT should look. The most telling feature across all scans is the contrast between light and dark areas. Typically, the nerve fiber layer and the underlying ganglion cell layer appear brighter than the densely packed nuclear layers. This is followed by the inner plexiform layer interface, which presents as a bright, hyperreflective area.
The inner nuclear layer, composed of densely packed nuclei, appears dark. This is followed by the outer plexiform layer, the outer nuclear layer, and Henle’s layer. The external limiting membrane, an important landmark for assessing retinal health, is also visible. The ellipsoid zone (EZ) is another bright layer, while the interdigitation zone may not always be distinguishable from the underlying RPE layer, even in healthy eyes. Finally, the RPE and inner choroid appear hyperreflective.
Structure
The ELM and EZ are critical structures to assess. In a normal macula OCT, the distance between the EZ and ELM is shorter than between the EZ and the RPE. The apparent “elevation” of the EZ in the foveal center results from the elongated outer segments of the foveal cones.
It’s important to remember that not all retinal structures are readily visible on a normal macula OCT. For example, Henle’s fiber layer is more easily distinguished in the presence of retinal pathology, such as swelling or thinning. Similarly, Bruch’s membrane is usually not visualized unless there is a separation between the RPE and Bruch’s membrane, often indicative of disease.
Thickness
Choroidal thickness is another key factor in OCT assessment. A general rule of thumb is that the choroid (between the RPE and the outer choroidal boundary) is approximately as thick as the retina. Thinning of the choroid may be observed in myopic or older patients, while marked choroidal thickening can raise suspicion for diseases like central serous retinopathy.
The OCT scan also provides information about laterality. The nerve fiber layer is characteristically thicker near the optic nerve head. Conversely, if the nerve fiber layer is not visualized in its expected location on an otherwise OCT normal scan, it could signal significant nerve fiber layer loss, potentially due to glaucoma or other optic neuropathies.
Reflectivity
Specific OCT terminology helps describe scans and differentiate normal findings from pathology.
Two fundamental concepts in OCT interpretation are hyporeflectivity and hyperreflectivity, which form the basis for understanding the structural composition of the retina as visualized in an OCT scan.
Hyporeflectivity refers to the increased light transmission capacity of a structure. The OCT scanning laser beam passes through hyporeflective structures with minimal reflection. The quintessential example of a hyporeflective structure is the vitreous humor. It appears as a dark area in the uppermost portion of a normal OCT scan, situated above the retina.
But hyporeflectivity can also be pathological, deviating from the patterns observed in a normal macula OCT; in the retina, it manifests in three primary ways.
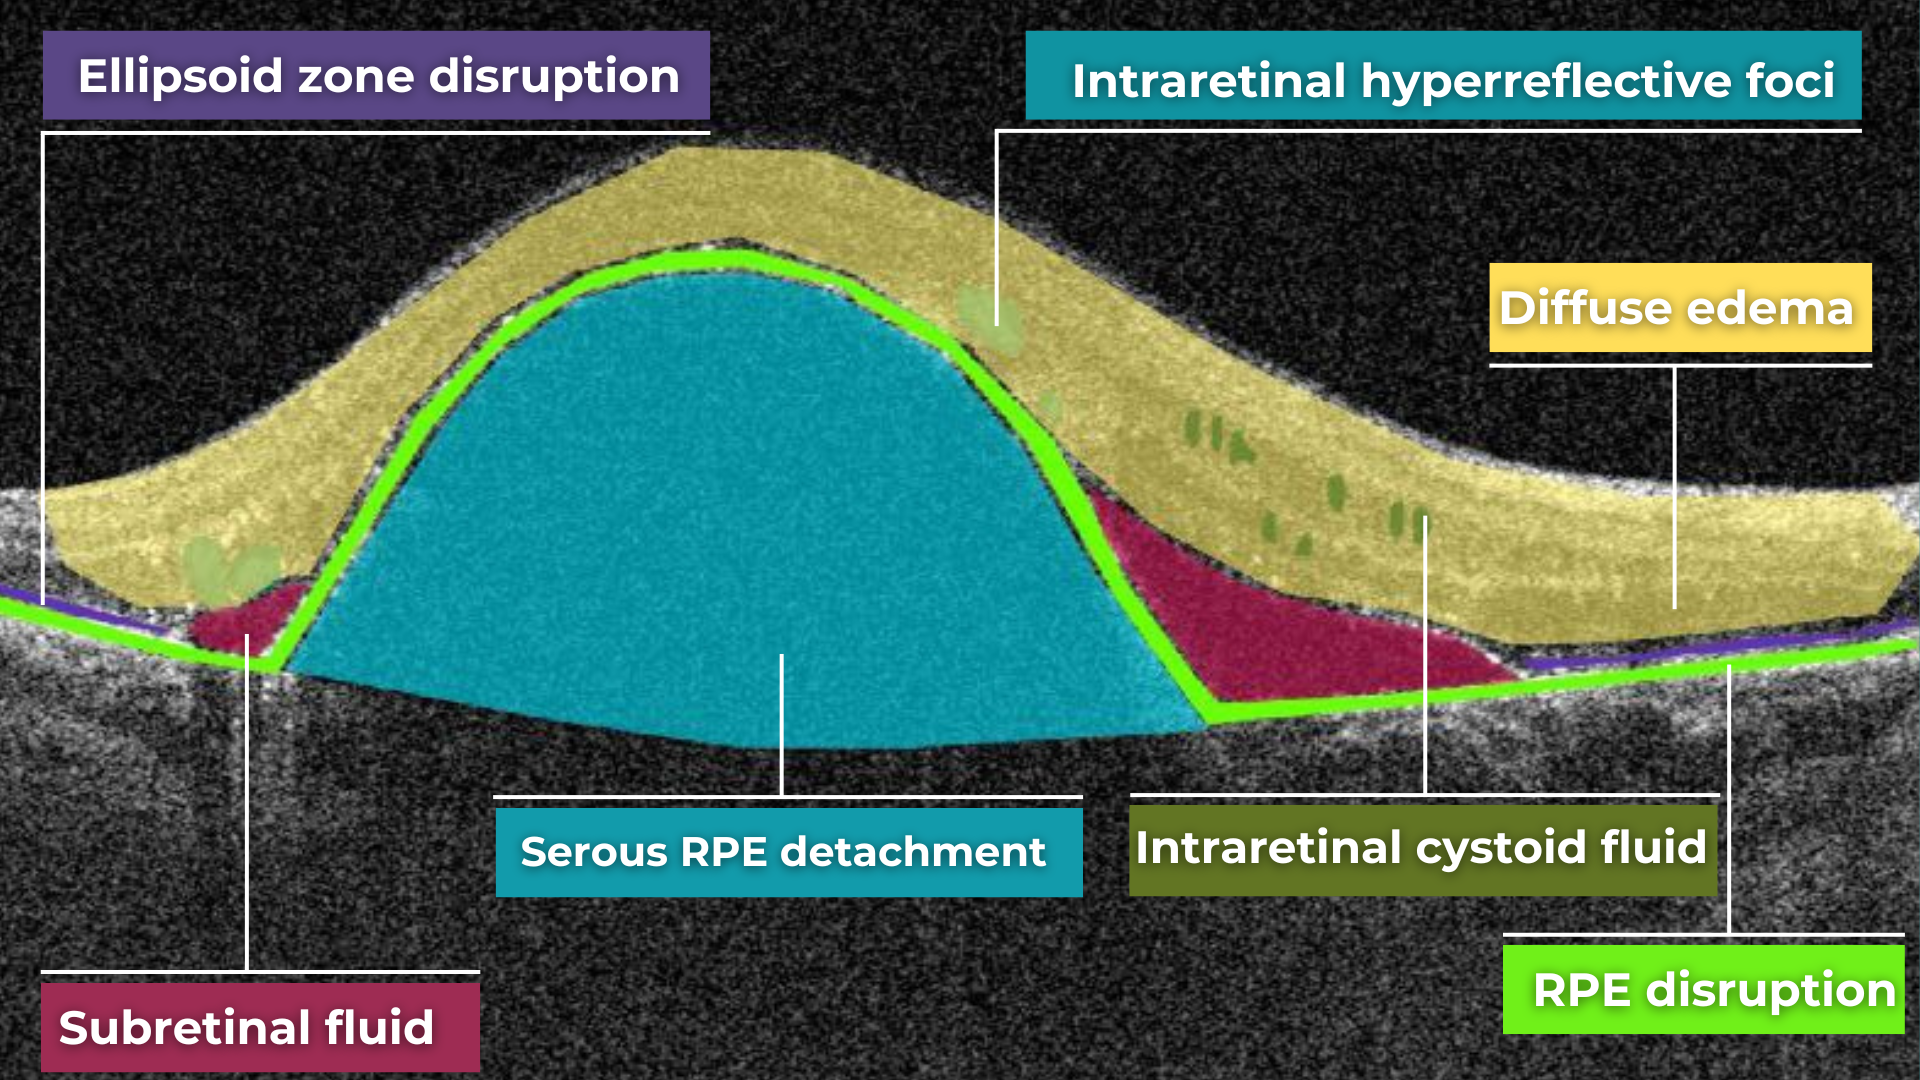
Like the vitreous, subretinal fluid exhibits high light transmission and appears black on OCT. A uniformly black region suggests the fluid lacks cellular debris or other inclusions.
Subretinal fluid on OCT
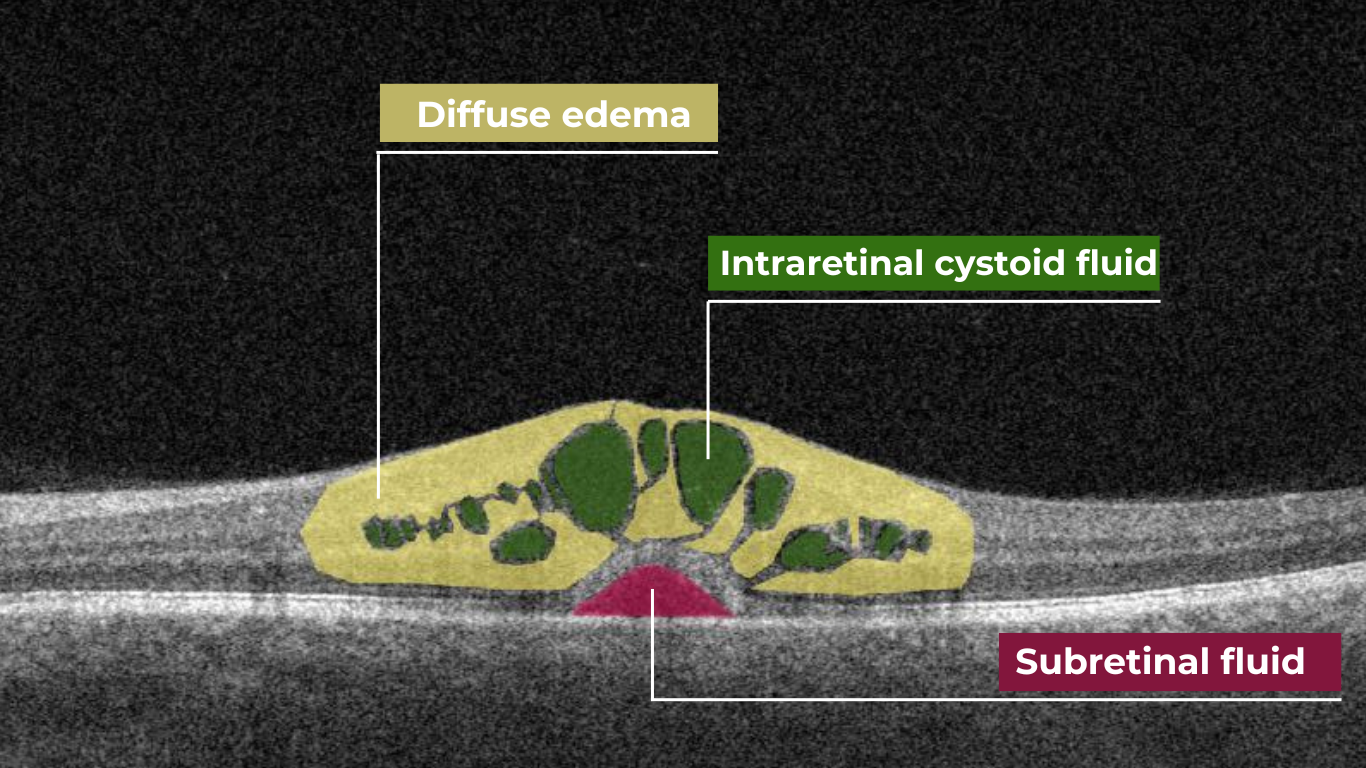
Fluid can also accumulate within the retinal layers, for example, between the layers of the neuroepithelium. This intraretinal fluid also appears hyporeflective on OCT.
Intraretinal fluid on OCT
Following a degenerative process within the retina, a cavity or void may form where retinal tissue has been lost. These degenerative cavities lack the cellular components necessary to reflect light and thus appear as dark spaces on OCT. It’s important to differentiate these cavities from cystic spaces, which may have distinct clinical implications.
One example is outer retinal tubulations. While associated with various diseases, outer retinal tubulations (ORTs) generally indicate outer retinal degeneration and atrophy.
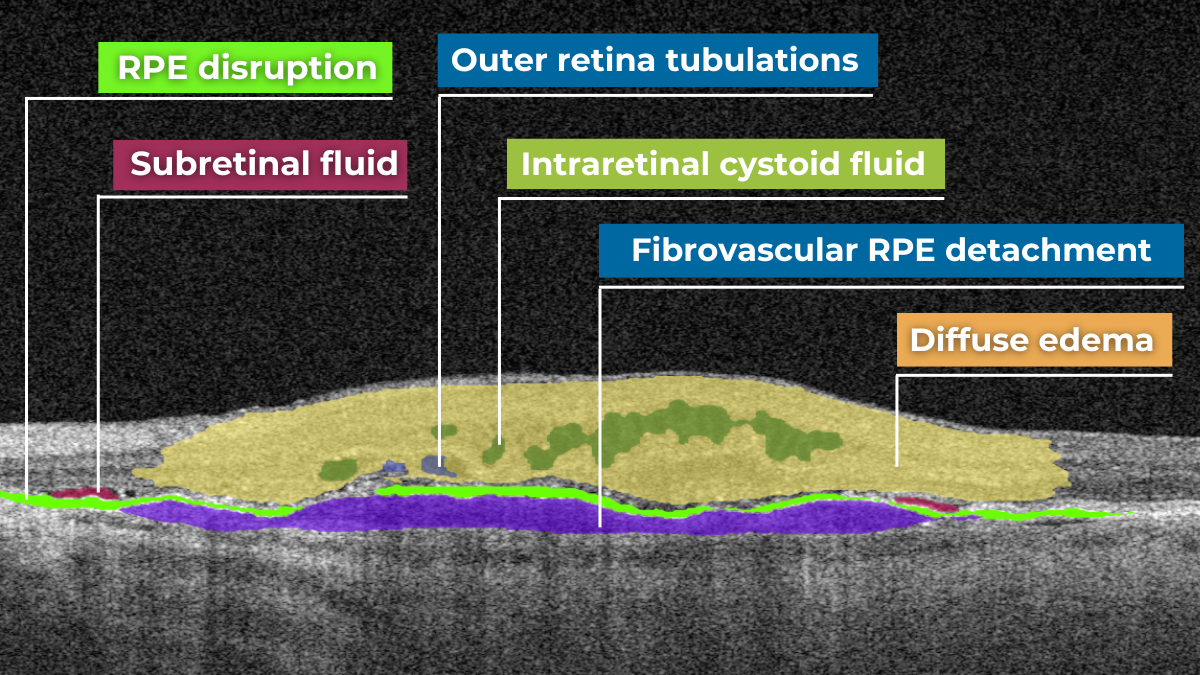
Outer retinal tubulations on OCT
Hyperreflectivity, unlike hyporeflectivity, indicates structures with high light reflectance. On the grayscale spectrum of an OCT image, hyperreflective structures appear progressively whiter.
The retinal pigment epithelium (RPE) complex and Bruch’s membrane are considered the most hyperreflective structures in a normal macula OCT.
Pathological processes can introduce new hyperreflective elements within the retina, aiding in differentiating normal and abnormal OCT scans. A typical example is hard exudates, frequently observed in diabetic retinopathy. These lipid-rich deposits are extremely dense, causing them to appear bright white on OCT due to the complete reflection of incident light. Furthermore, this high density leads to a shadowing effect beneath the deposits, caused by strong backscattering of the OCT signal.
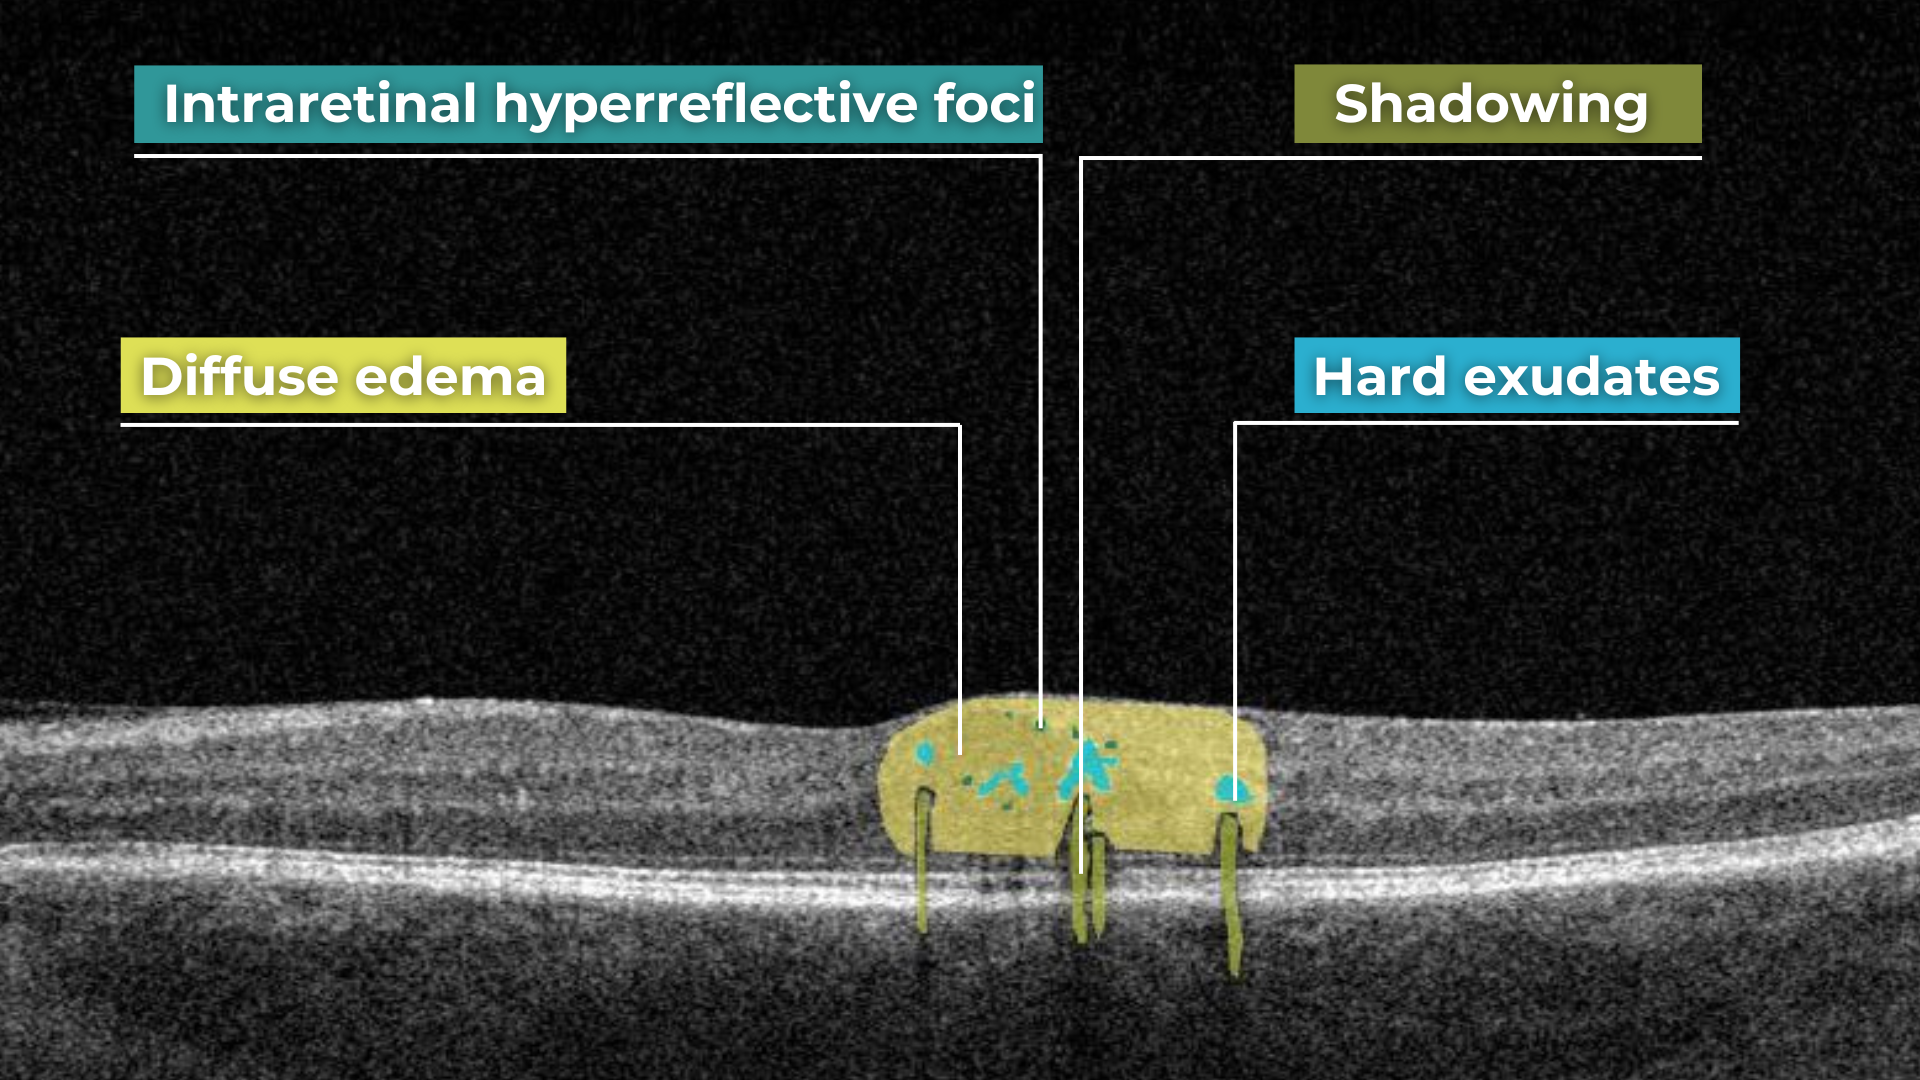
Hard exudates and shadowing on OCT
Epiretinal membranes (ERMs) – a thin membrane or layer of scar tissue that forms over the retina – are also hyperreflective. It is composed of dense connective tissue with high light-reflecting properties and appears white on OCT scans.
Integrity
Beyond hypo- and hyperreflectivity, OCT interpretation involves assessing the structural integrity of retinal layers. For instance, in an OCT scan of a normal eye, Bruch’s membrane appears as a thin, continuous line underlying the retinal pigment epithelium (RPE). The RPE is a monolayer of cells, ideally presenting with a smooth and uniform optical density. However, some pathologies, particularly early stages of age-related macular degeneration (AMD), may show unevenness or integrity loss in the RPE and Bruch’s membrane complex.
Disruption of the ellipsoid zone (EZ) is a particularly concerning finding on OCT, often indicating photoreceptor damage. Significant disruption of the EZ in the central macula is a strong biomarker for adverse visual outcomes.
The closer the loss of integrity extends toward the foveal center, the poorer the visual prognosis tends to be.
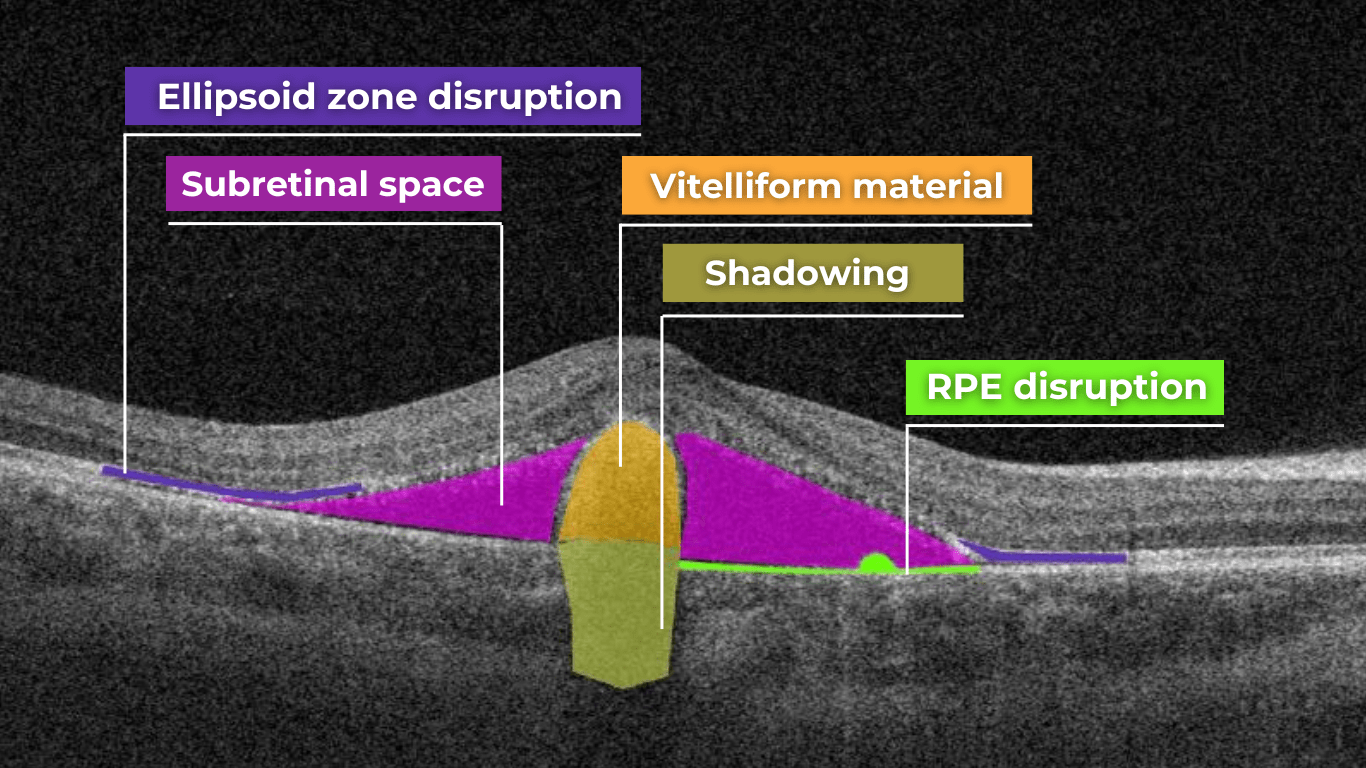
Ellipsoid zone disruption on OCT
OCT also plays a crucial role in visualizing and characterizing breaks in the structural integrity of the retina. These breaks, commonly referred to as retinal tears or holes, can be classified as full-thickness or partial-thickness, depending on the extent of retinal involvement.
Full-thickness breaks completely separate all retinal layers, while partial-thickness breaks involve only some retinal layers. OCT allows for precise delineation of the layers involved and the overall morphology of the break.
Retinal holes can also be categorized by their location. Macular holes, as the name suggests, involve the central retina and can lead to significant central vision loss and require prompt attention.
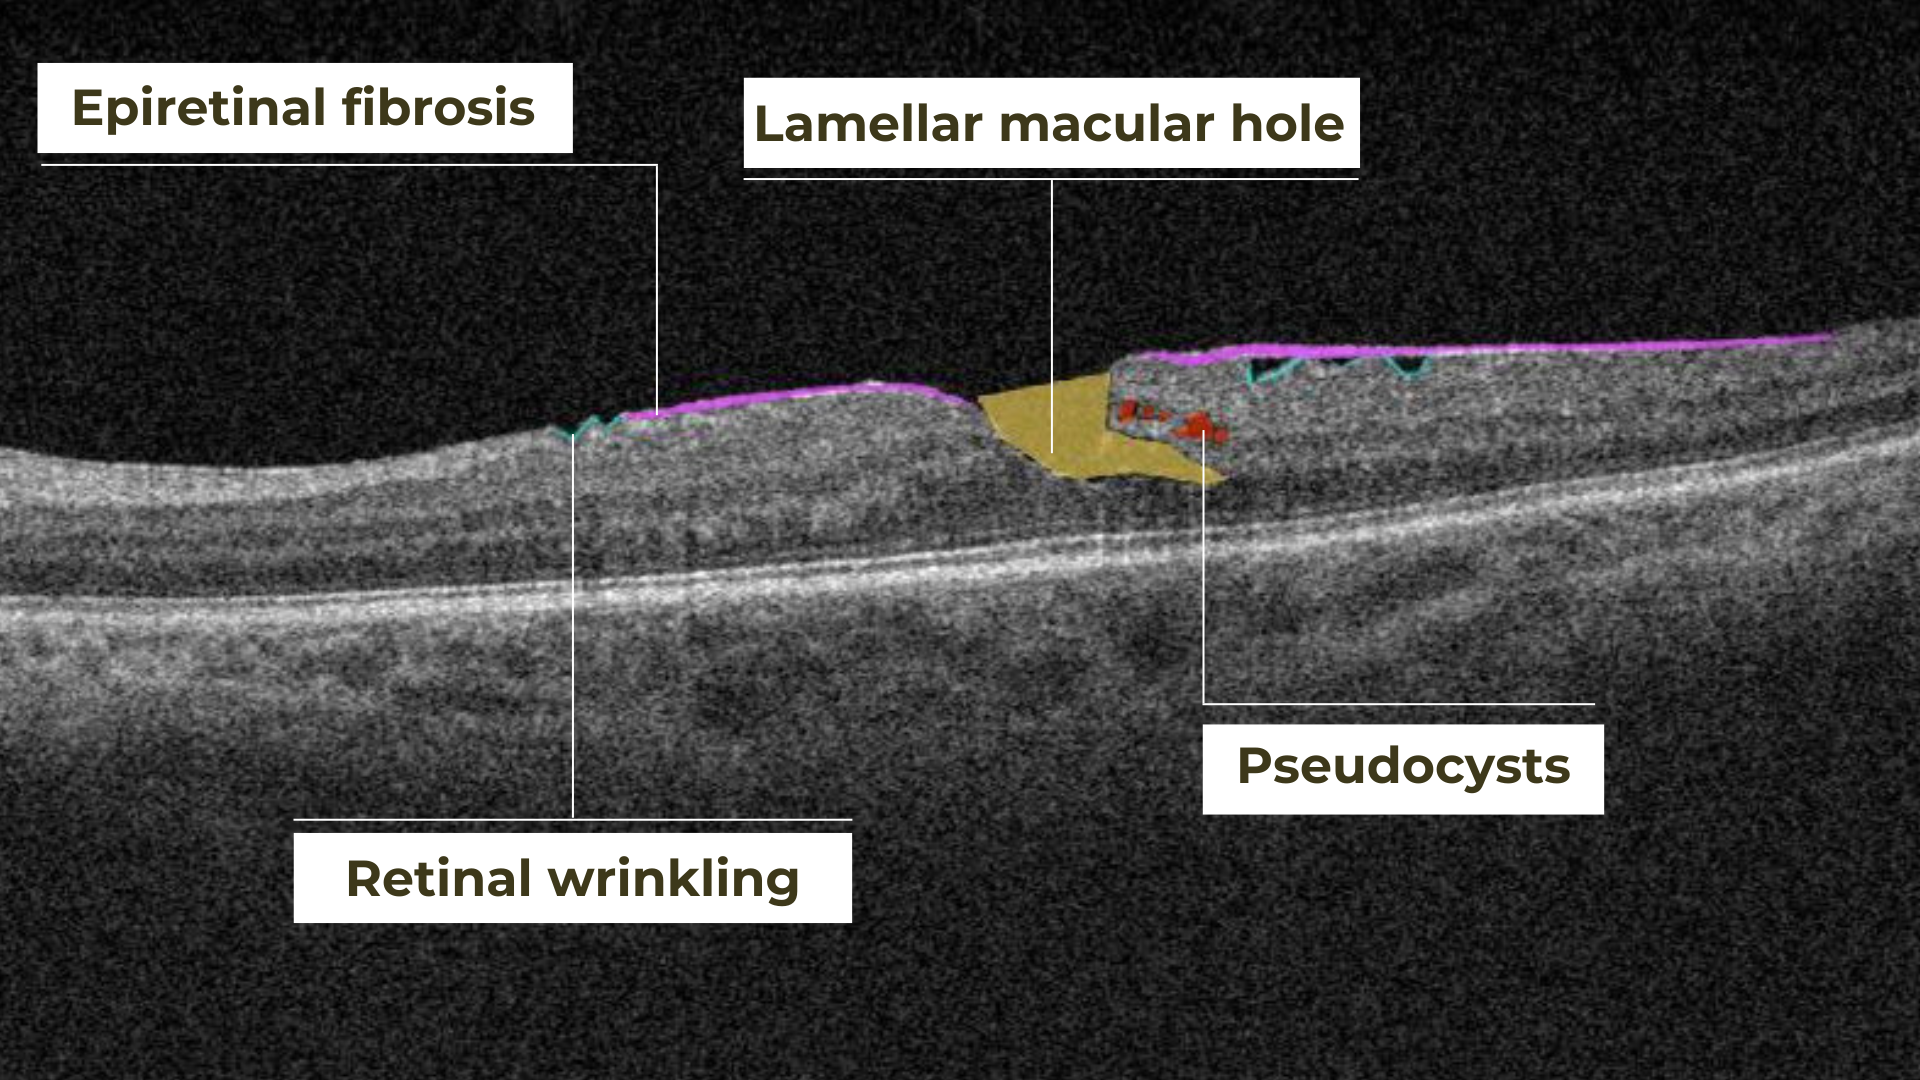
Lamellar macular hole on OCT
Non-macular holes occur outside the central macular region, often in the peripheral retina. While they may not cause immediate central vision disturbances, they can still lead to serious complications, such as retinal detachment, if left untreated.
Definition
The blurring of retinal structures, or loss of definition, is another key OCT concept. This loss of the retina’s normal layered organization, seen in diseases like AMD, manifests as indistinct layers merging into a homogenous mass.
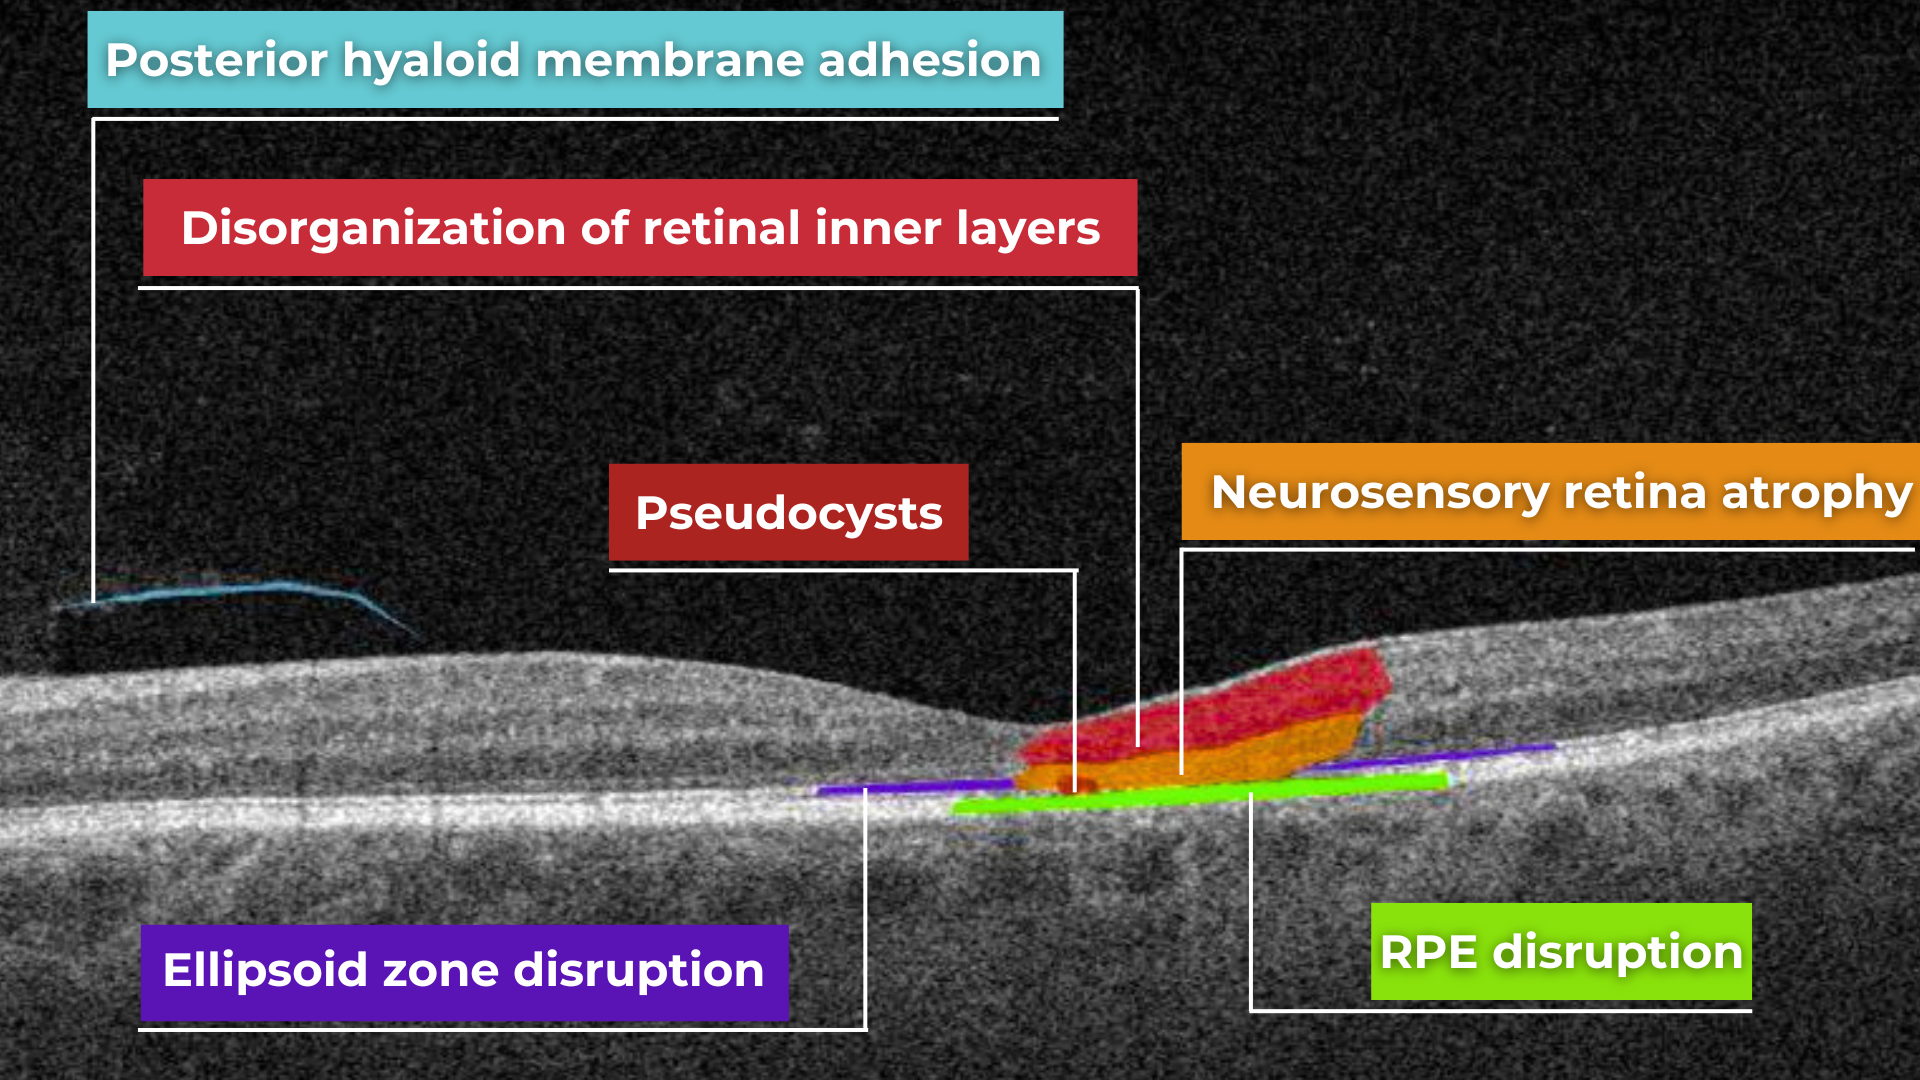
Disorganisation of retinal inner layers on OCT
Hypertransmission in OCT refers to enhanced signal penetration due to reduced blockage of the OCT light signal. This phenomenon is frequently observed in geographic atrophy, a late stage of AMD characterized by the atrophy of the retinal pigment epithelium, choriocapillaris, and photoreceptors.
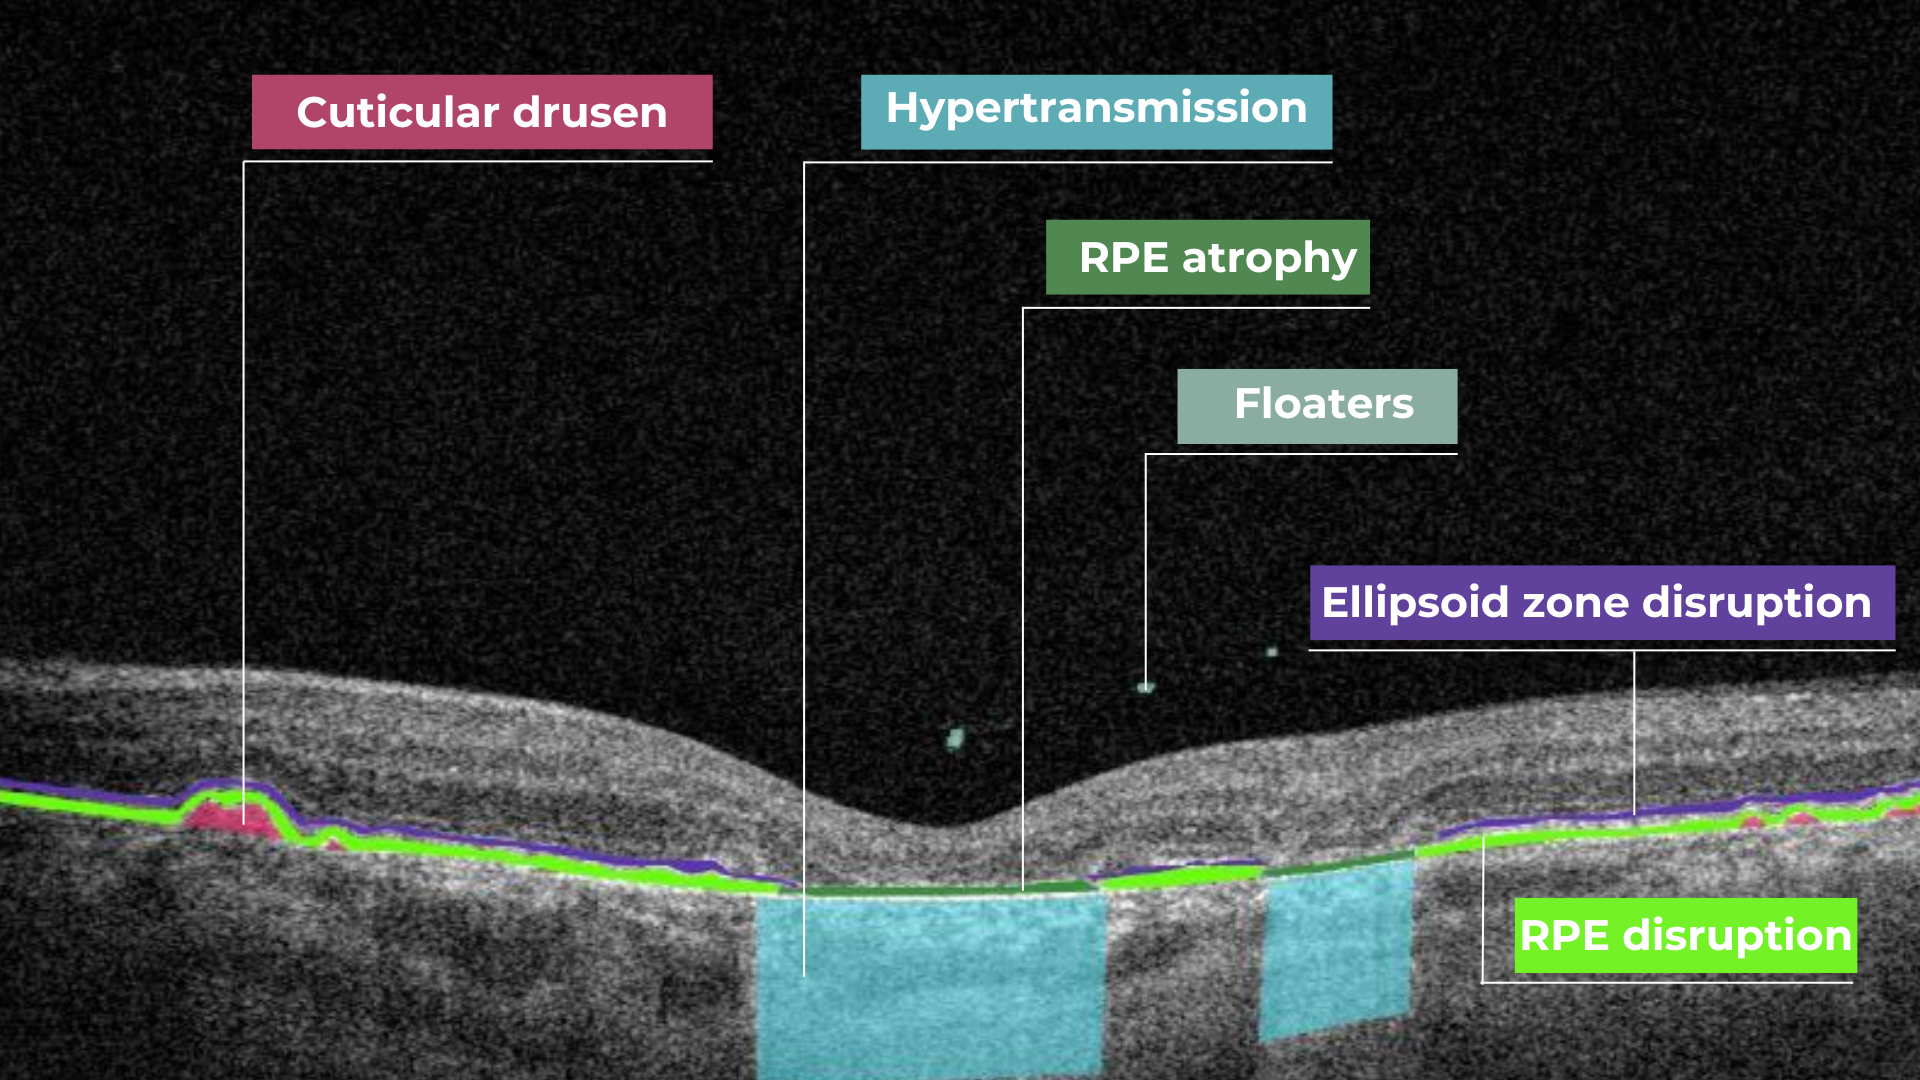 Hypertransmission on OCT
In a normal macula OCT, a signal is attenuated as it traverses the various retinal layers, with a portion of the signal being reflected to the detector. However, in geographic atrophy (GA), the loss of RPE and other retinal structures reduces this attenuation, allowing the OCT signal to penetrate deeper into the choroid. This increased penetration results in a stronger signal return from the choroidal layers, creating essentially a “corridor” of enhanced signal penetration through the atrophic areas of the retina. This deep penetration and strong signal return, unfortunately, indicate significant retinal damage and are associated with a poor visual prognosis.
Displacement
Another term used to describe OCT scan results is elevation. It refers to the upward displacement of retinal structures from their normal anatomical position. In the context of age-related macular degeneration (AMD), elevation is frequently associated with the presence of drusen.
Drusen are extracellular deposits that accumulate between the retinal pigment epithelium (RPE) and Bruch’s membrane. They are a hallmark of AMD and can vary in size, shape, and composition. Drusen are typically categorized as hard, soft, or confluent based on their ophthalmoscopic appearance.
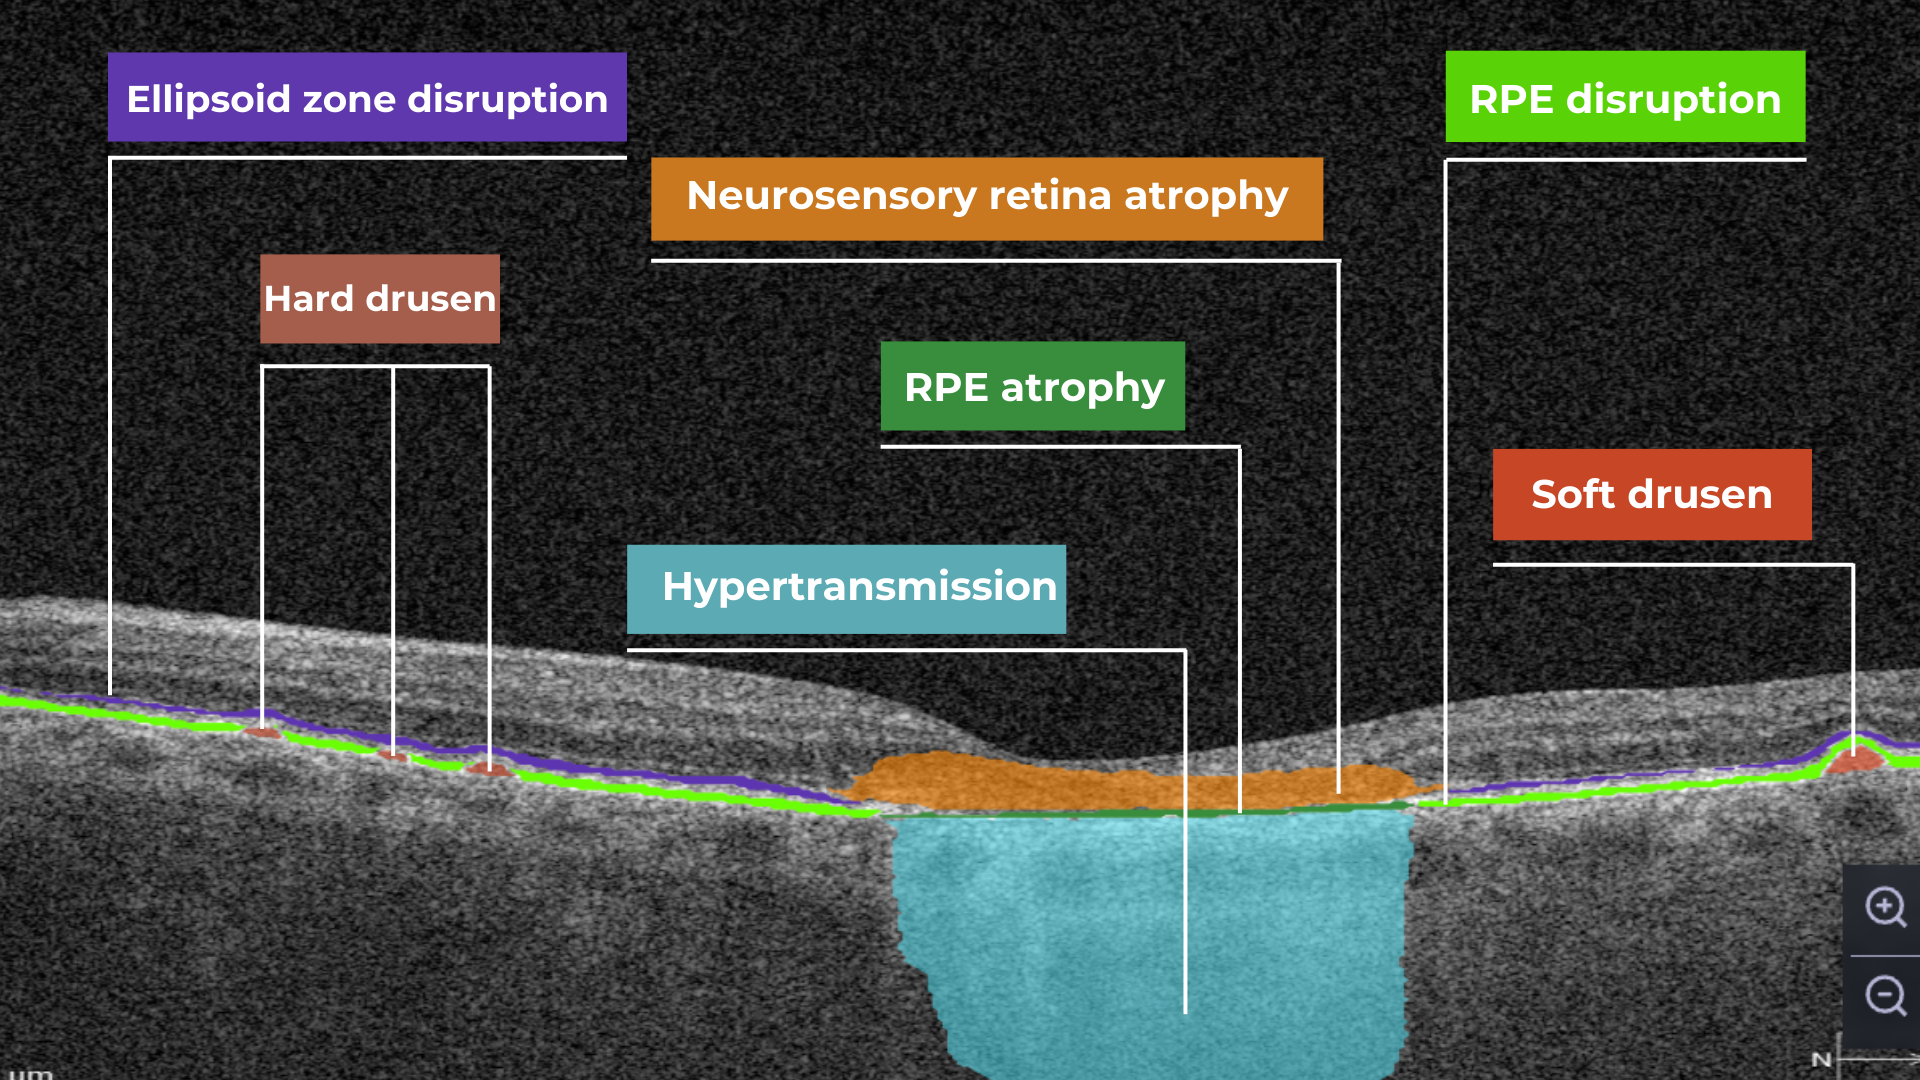
Hard and soft drusen on OCT
In contrast to elevation, depression in OCT describes the inward displacement or concavity of retinal structures. This can be a manifestation of various pathological processes, with a prominent example of degenerative myopia.
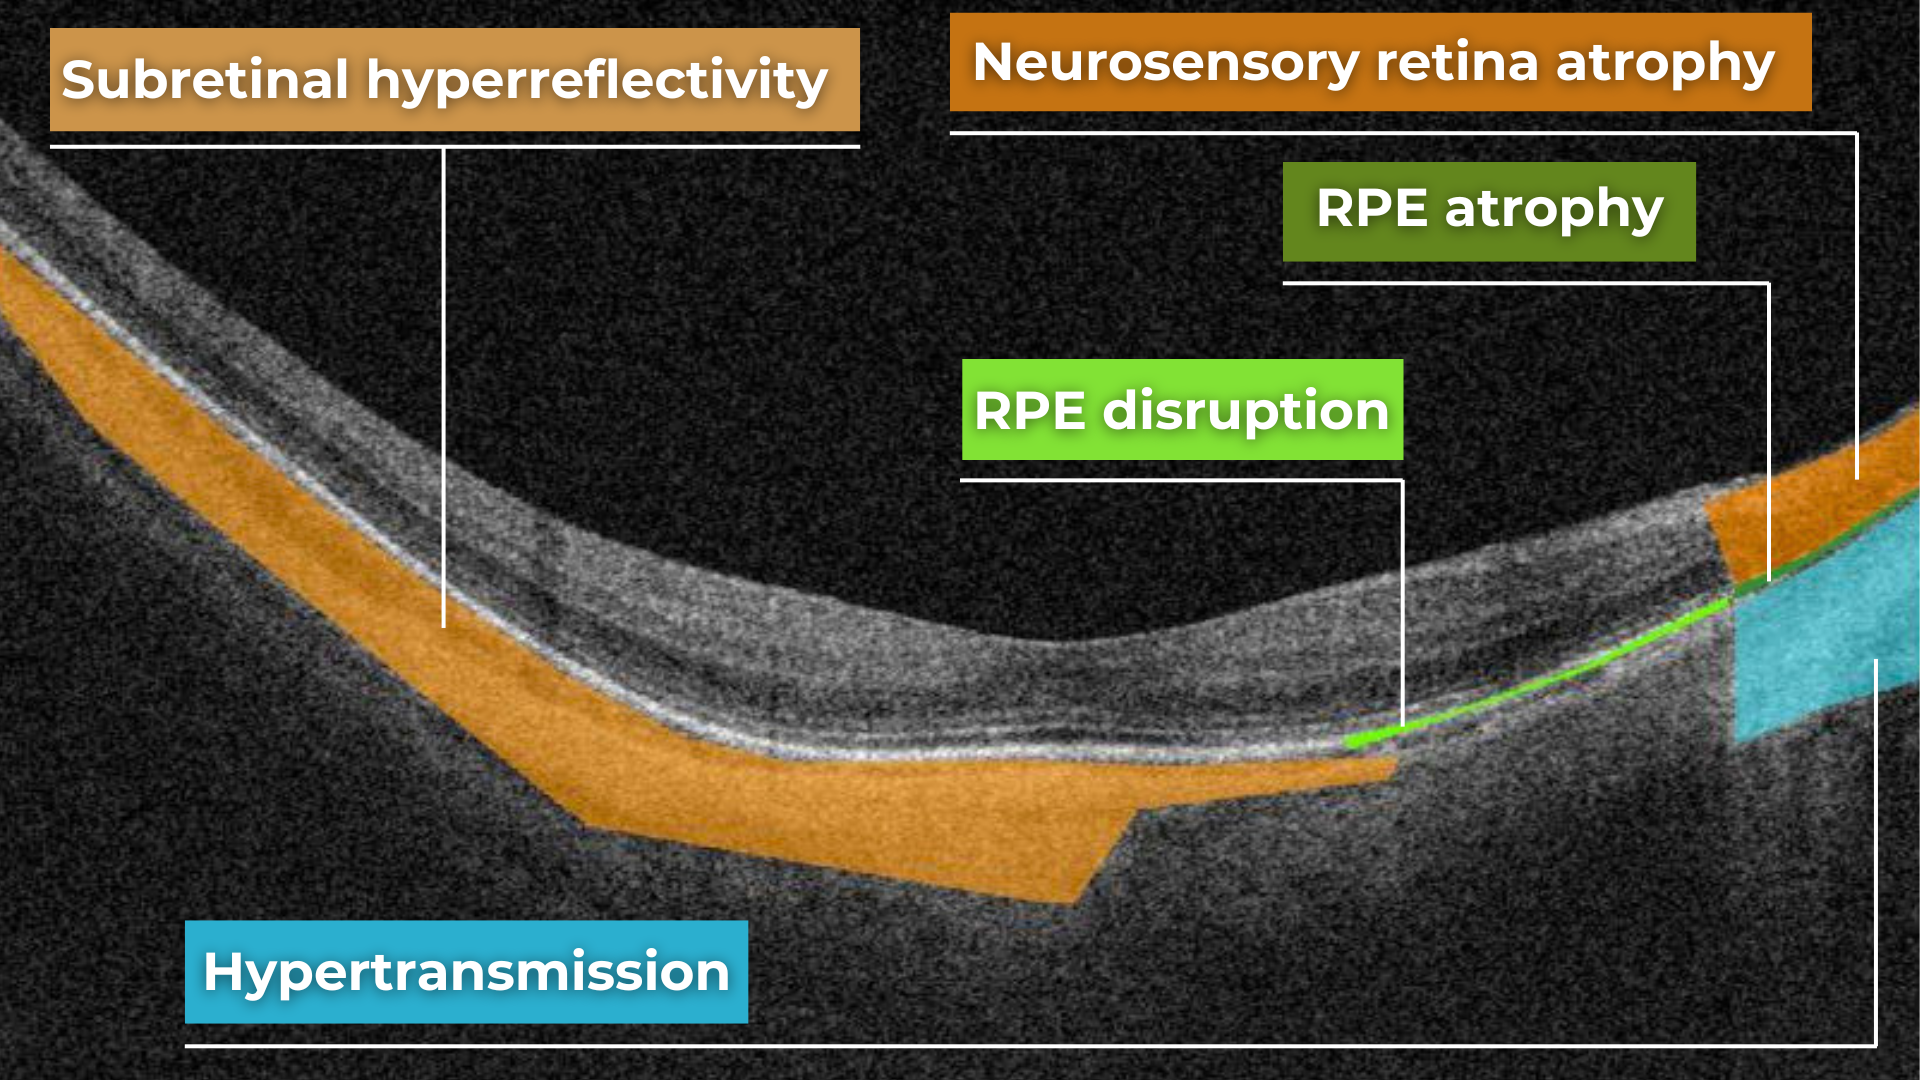
Degenerative myopia on OCT
OCT scan: normal eye transformation through pathologies
Age-related macular degeneration (AMD)
AMD is an acquired degenerative macular disease usually affecting individuals over the age of 55 years. It is characterized by pathologic alterations of the outer retina, retinal pigment epithelium (RPE), Bruch’s membrane, and choriocapillaris complex, including drusen formation and pigmentary changes.
AMD is a progressive disease, and in advanced stages, central geographic atrophy and neovascularization, may develop and reduce vision. OCT plays a critical role in distinguishing between the different stages and forms of AMD, particularly when compared to the features of an OCT normal scan.
Wet AMD
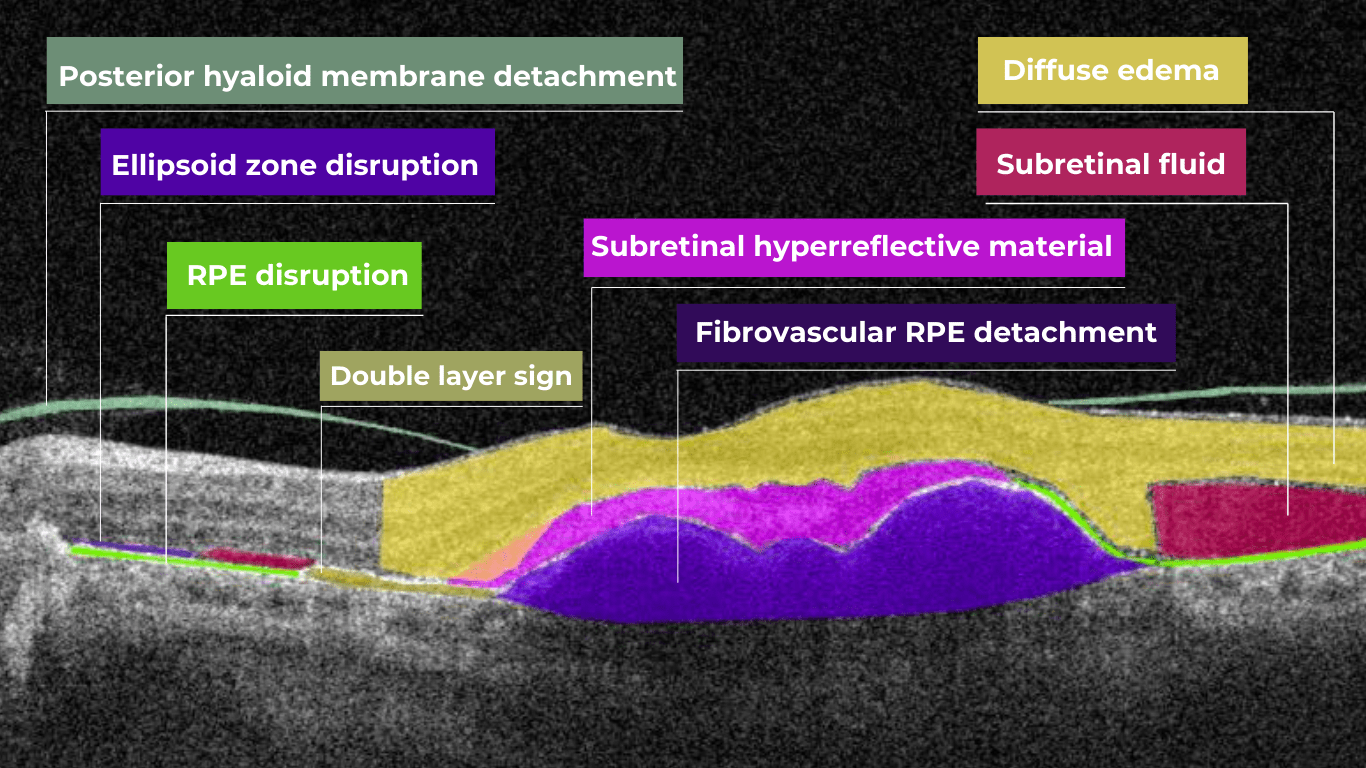
Neovascular or “wet” age-related macular degeneration (nAMD) arises from the aberrant growth of choroidal vessels that penetrate Bruch’s membrane and invade the subretinal space. These abnormal vessels leak fluid and blood, disrupting the retinal architecture and causing vision loss.
Several key OCT features can signal the presence and activity of nAMD in comparison to a normal OCT scan:
- Fluid Accumulation: The presence and location of fluid are hallmarks of nAMD (hence the term ‘wet AMD’). Intraretinal fluid, appearing within the retinal layers, often signifies more severe disease and a poorer visual prognosis than subretinal fluid, which accumulates beneath the retina.
- RPE Detachment: Serous PED appears as a dome-shaped elevation of the RPE due to fluid accumulation beneath it. PEDs often accompany nAMD and can vary in size and shape.
- Disruption of Retinal Layers: nAMD can disrupt the normal retinal architecture, particularly the photoreceptor layer. Damage to the ellipsoid zone (EZ) and external limiting membrane (ELM) is visible on OCT and correlates with visual impairment.
- Hyperreflective Foci: Hyperreflective dots (HRDs) are small, bright spots scattered throughout the retina.
- Subretinal Hyperreflective Material (SHRM): Appears as a hyperreflective band between the retina and RPE. Its composition varies but may include fluid, fibrin, blood, and neovascular tissue; it can be associated with poorer visual outcomes.
- RPE Tears: These are disruptions in the RPE monolayer, often occurring in areas of PED. RPE tears can lead to significant vision loss and are an important complication of nAMD.
- Choroidal Changes: nAMD can also affect the choroid, the vascular layer beneath the RPE.
Dry AMD

In its early stages, Dry AMD is characterized by drusen and pigmentary abnormalities resulting from alterations in the retinal pigment epithelium (RPE). Later, it can progress to geographic atrophy (GA) or outer retinal atrophy.
The three classic findings in Dry AMD are drusen, pigmentary changes, and geographic atrophy.
Drusen are classified as:
- small (<65 um),
- medium (65 – 124 um),
- or large (>125 um).
While both drusen and pigmentary changes can appear as yellowish deposits in the retina, pigmentary changes are often more varied in color (ranging from yellow to brown or black) and less defined in shape than the generally circular drusen.
Geographic atrophy typically begins in the paracentral macula, often surrounding the fovea in a horseshoe pattern. It can eventually involve the fovea itself, leading to severe vision loss.
Diabetic Retinopaty (DR)
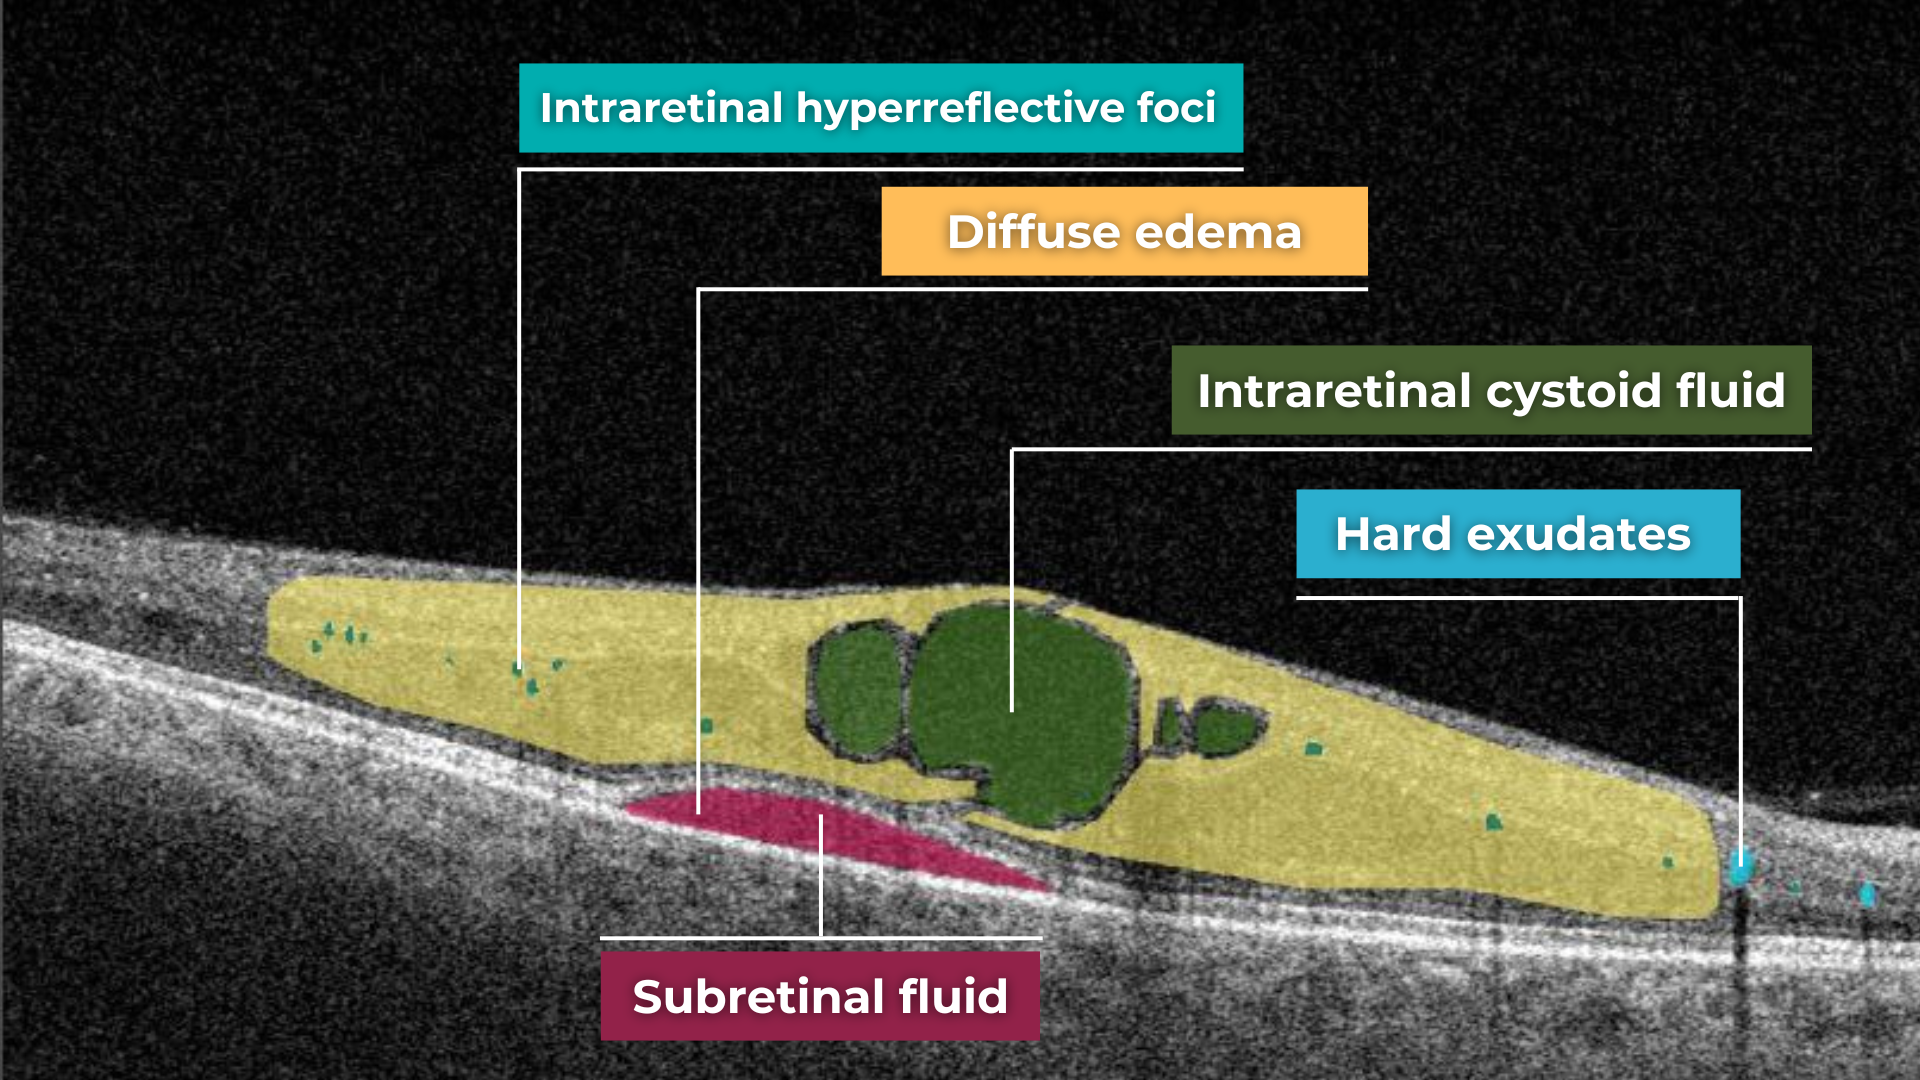
Diabetic retinopathy (DR), a leading cause of vision loss in working-age populations, is characterized by retinal vascular abnormalities. It progresses from non-proliferative DR (NPDR), marked by vascular leakage and capillary occlusion, to proliferative DR (PDR), where neovascularization can lead to severe vision impairment through vitreous hemorrhage or retinal detachment.
OCT can aid in identifying the earliest sign of DR: microaneurysms. They appear as small, distinct, oval-shaped, hyperreflective, walled structures associated with microvascular damage. Specifically, the structural weakness of the vessel wall of MAs causes fluid leakage, resulting in edema.
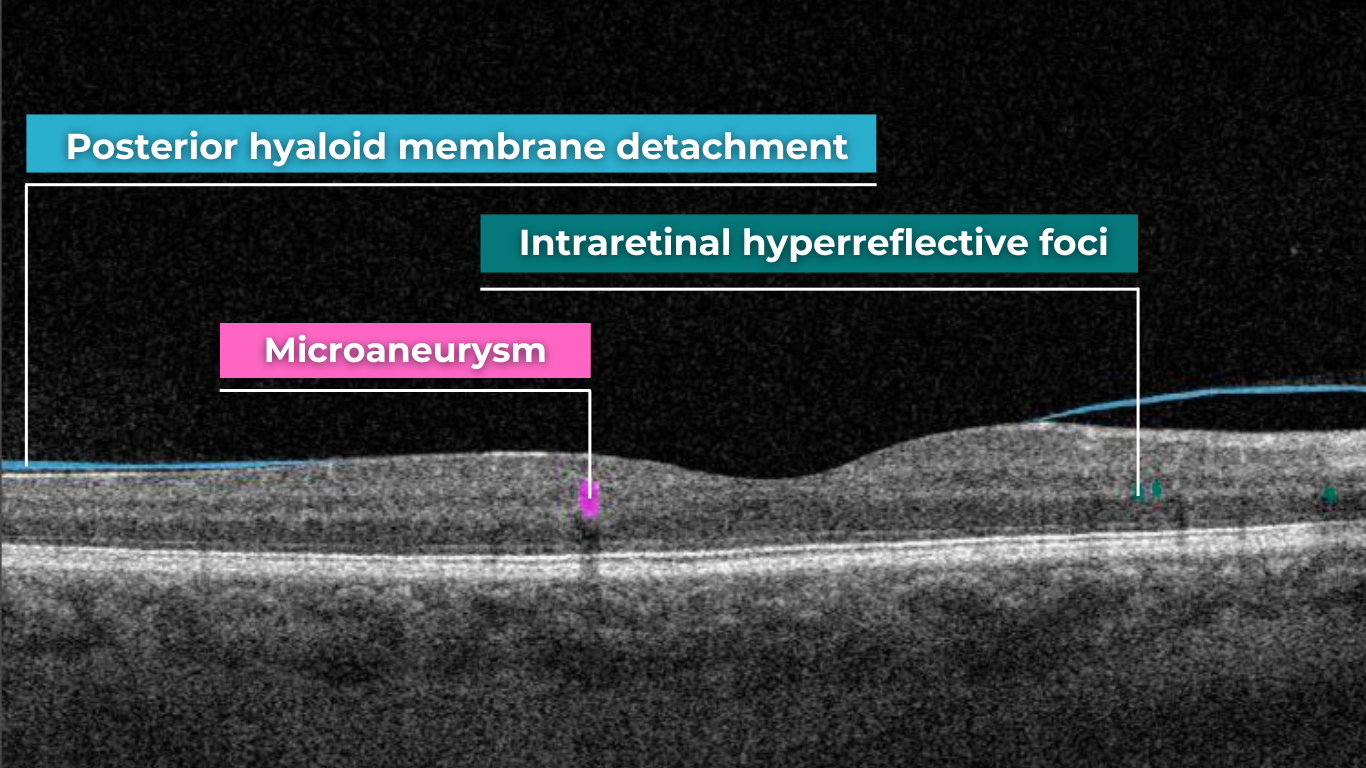
Another consequence of microaneurysm formation is the progression to intraretinal hemorrhages (IRH), often called ‘dot-blot’ hemorrhages. These appear as hyperreflective foci on OCT cross-sections, with varying degrees of opacification.
Diabetic macular edema (DME) can occur at any stage of the disease and is the most common cause of vision loss in those with diabetes. It results from a blood-retinal barrier breakdown, leading to fluid leakage and retinal thickening.
Retinal vein occlusions
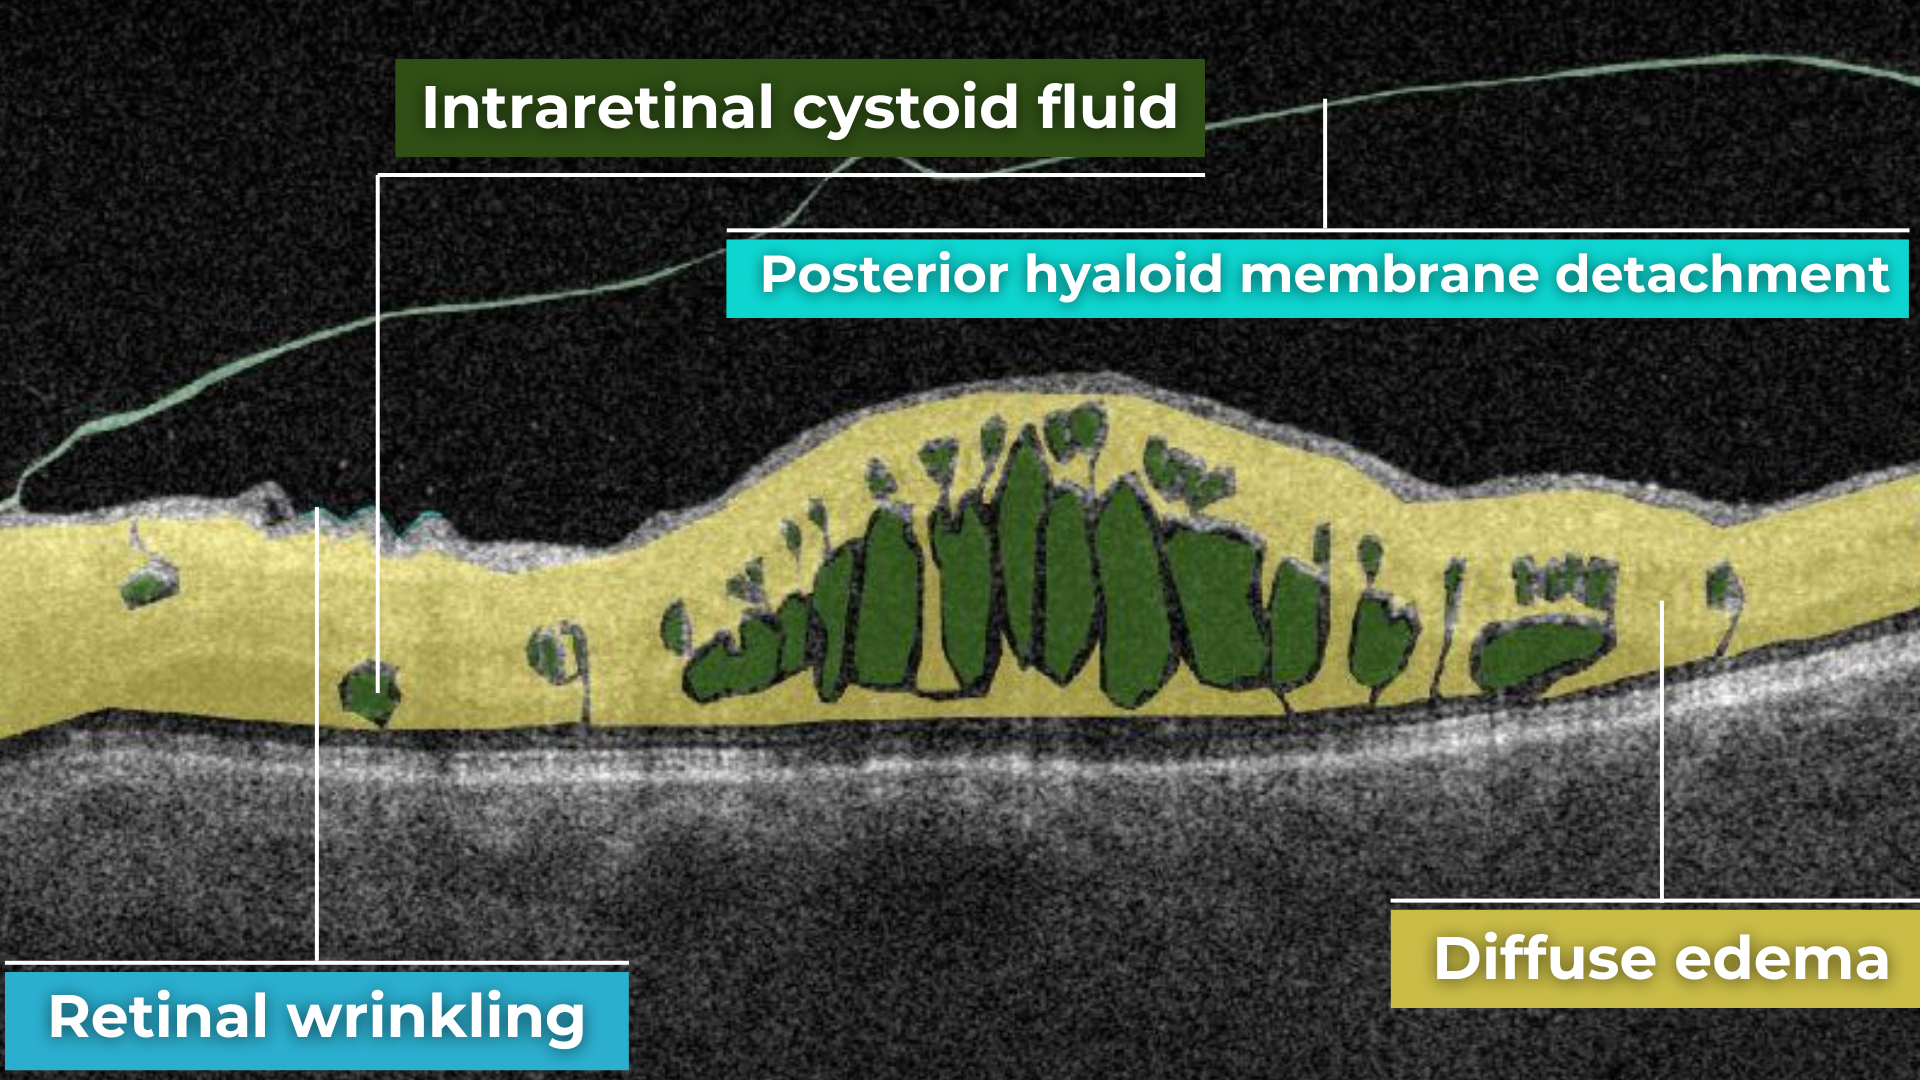
Retinal vein occlusions (RVOs) are blockages of the retinal veins responsible for draining blood from the retina. These blockages can affect either the central retinal vein (CRVO) or one of its branches (BRVO). RVOs are more prevalent in older individuals and those with underlying vascular conditions such as high blood pressure, high cholesterol, a history of heart attack or stroke, diabetes, or glaucoma. The primary vision-threatening complications of RVO are macular edema, which involves fluid accumulation in the central retina, and retinal ischemia, which results from insufficient blood flow to the retina.
While both Central Retinal Vein Occlusion (CRVO) and Branch Retinal Vein Occlusion (BRVO) involve blockage of a retinal vein, the underlying cause and location of the blockage differ.
CRVO occurs when a thrombus (blood clot) blocks the central retinal vein near the lamina cribrosa, where the optic nerve exits the eye.
In contrast, BRVO typically occurs at an arteriovenous crossing point, where a retinal artery and vein intersect. Atherosclerosis (hardening of the arteries) can compress the vein at this crossing point, leading to thrombus formation and occlusion.
In CRVO, the retina often exhibits extensive intraretinal hemorrhages, dilated and tortuous veins, and cotton-wool spots. This constellation of findings is classically described as a “blood and thunder” appearance. In BRVO, the signs are typically localized to the area of the retina drained by the affected vein. Macular edema, characterized by retinal thickening and cystoid spaces within the retina, is a common finding in CRVO and BRVO and can significantly contribute to vision loss.
Central serous retinopathy
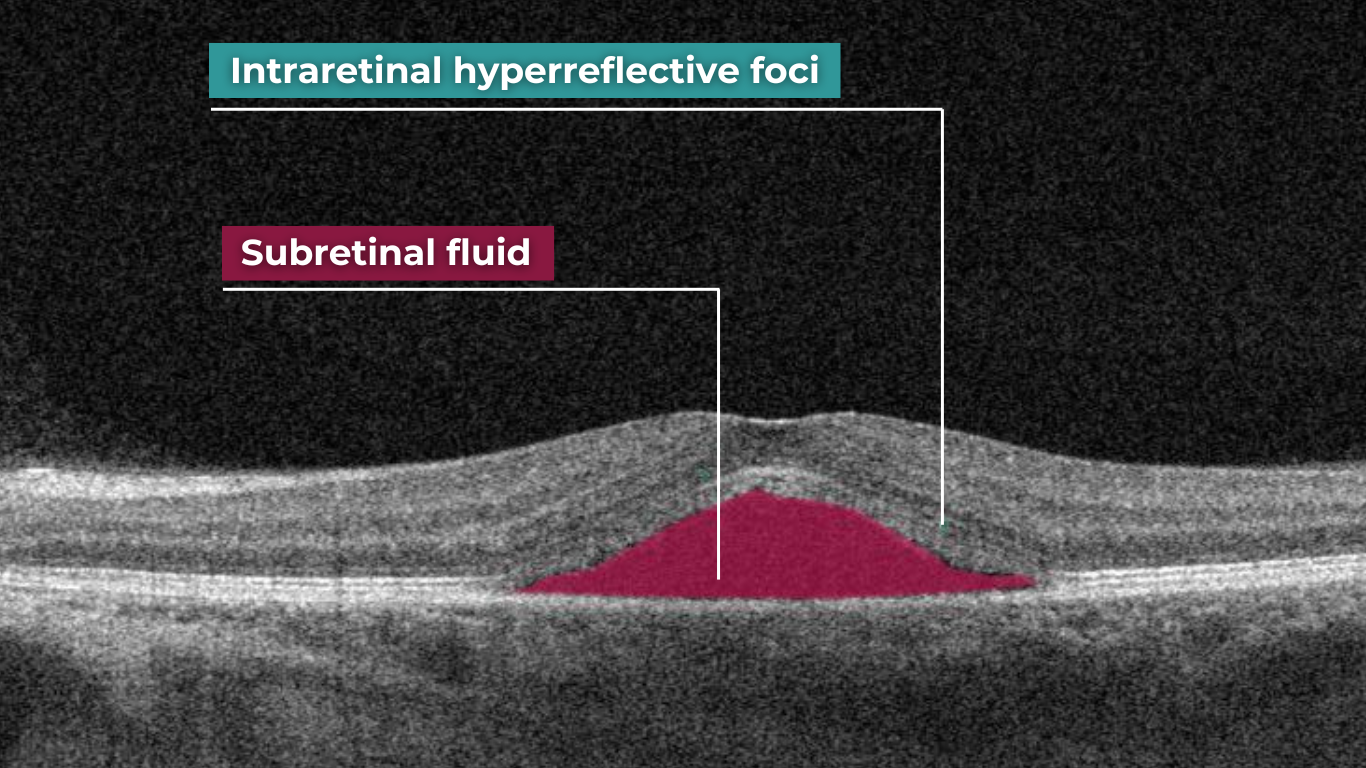
Central serous chorioretinopathy (CSCR) is a common retinal disorder that causes visual impairment and altered visual function. It is classified as a pachychoroid disease, including conditions like polypoidal choroidal vasculopathy and pachychoroid neovasculopathy.
OCT imaging in CSCR often reveals a thicker-than-average choroid.
This diagnostic is particularly useful in cases where clinical examination findings are inconclusive, distinguishing subtle differences between normal and abnormal OCT scans in terms of structural changes, such as small pigment epithelial detachments (PEDs) and hyperreflective subretinal fluid, that may not readily appear on clinical exams.
Furthermore, OCT is valuable for monitoring disease progression and resolution in chronic CSCR cases. A distinguishing feature that can also be seen in CSR is the appearance of the retinal pigment epithelium: the RPE line typically appears straight in non-affected areas, while it can appear wavy or irregular in areas with CSCR.
Epiretinal membrane (Epiretinal fibrosis)
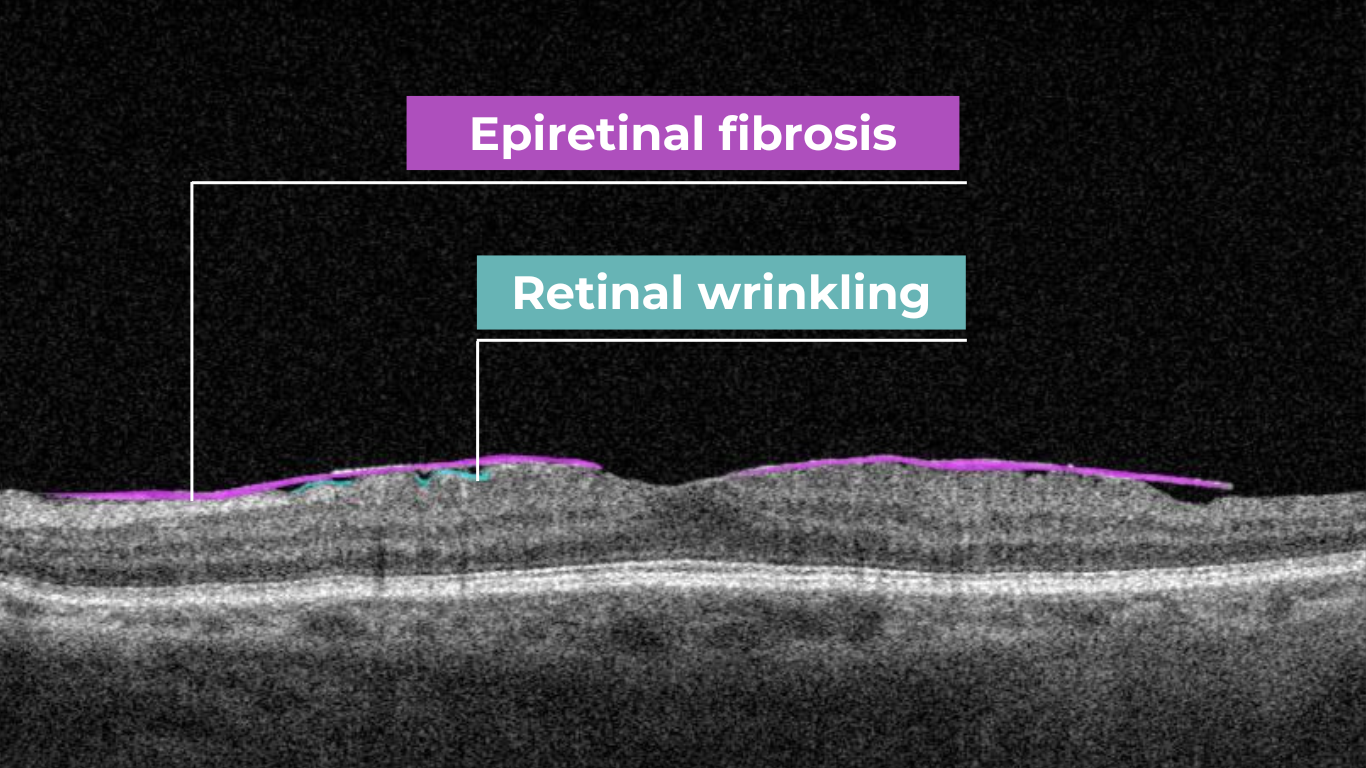
Epiretinal fibrosis (epiretinal membrane/macular pucker) is a common condition affecting the central retina, specifically the macula. It is characterized by a semi-translucent, avascular membrane that forms on the retinal surface, overlying the internal limiting membrane (ILM), which is absent on a normal macula OCT.
OCT plays a crucial role in assessing the severity of ERMs, revealing the extent of macular distortion and the involvement of retinal layers.
OCT findings in ERMs are used to stage the severity of the membrane, ranging:
- Stage 1: ERMs are mild and thin. Foveal depression is present.
- Stage 2: ERMs with widening the outer nuclear layer and losing the foveal depression.
- Stage 3: ERMs with continuous ectopic inner foveal layers crossing the entire foveal area.
- Stage 4: ERMs are thick with continuous ectopic inner foveal and disrupted retinal layers.
Retinal detachment
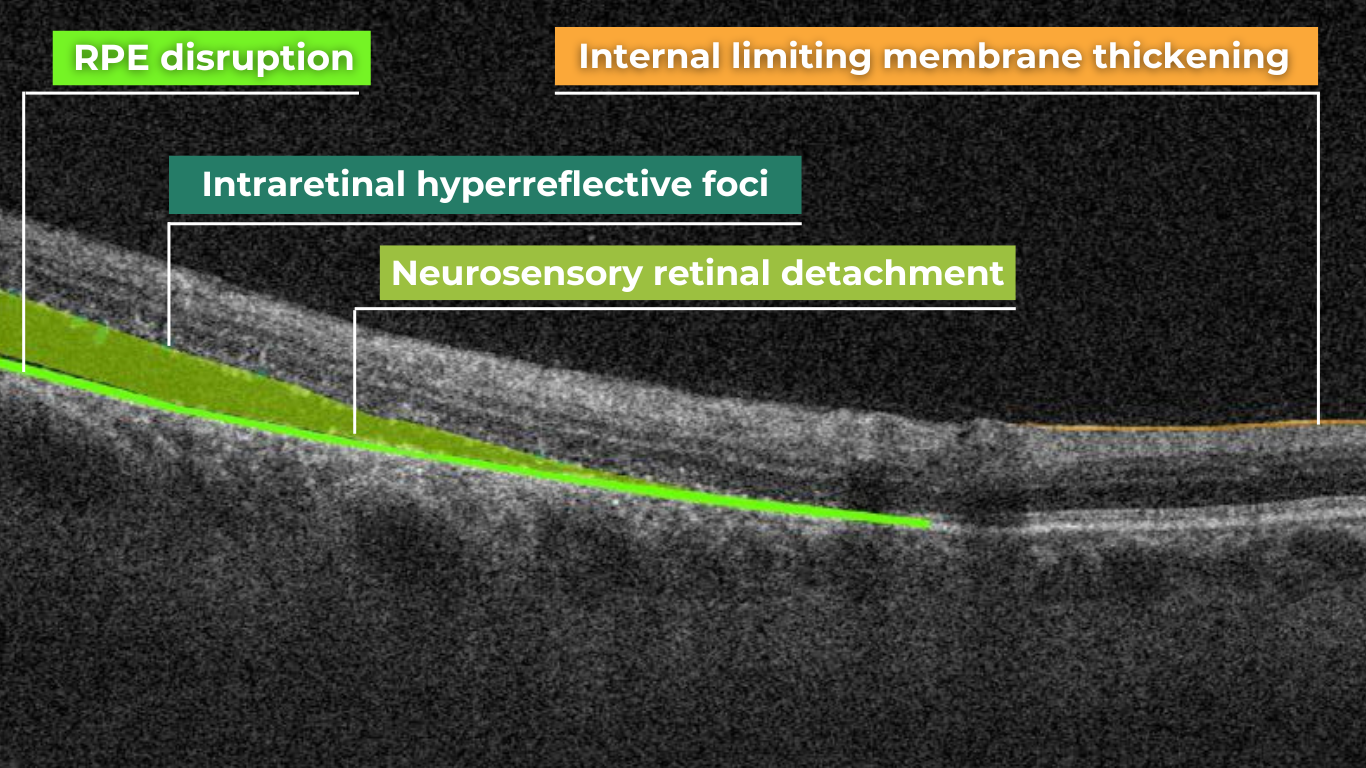
Retinal detachment is an important cause of decreased visual acuity and blindness, a common ocular emergency often requiring urgent treatment.
It occurs when subretinal fluid accumulates between the neurosensory retina and the retinal pigment epithelium through three mechanisms:
- Rhegmatogenous: a break in the retina allowing liquified vitreous to enter the subretinal space directly.
- Tractional: proliferative membranes on the surface of the retina or vitreous pull on the neurosensory retina, causing a physical separation between the neurosensory retina and retinal pigment epithelium
- Exudative: accumulation of subretinal fluid due to inflammatory mediators or exudation of fluid from a mass lesion/insufficient RPE function
OCT helps identify foveal status and diagnose tractional or exudative retinal detachments, aiding in treatment planning.
Macular hole
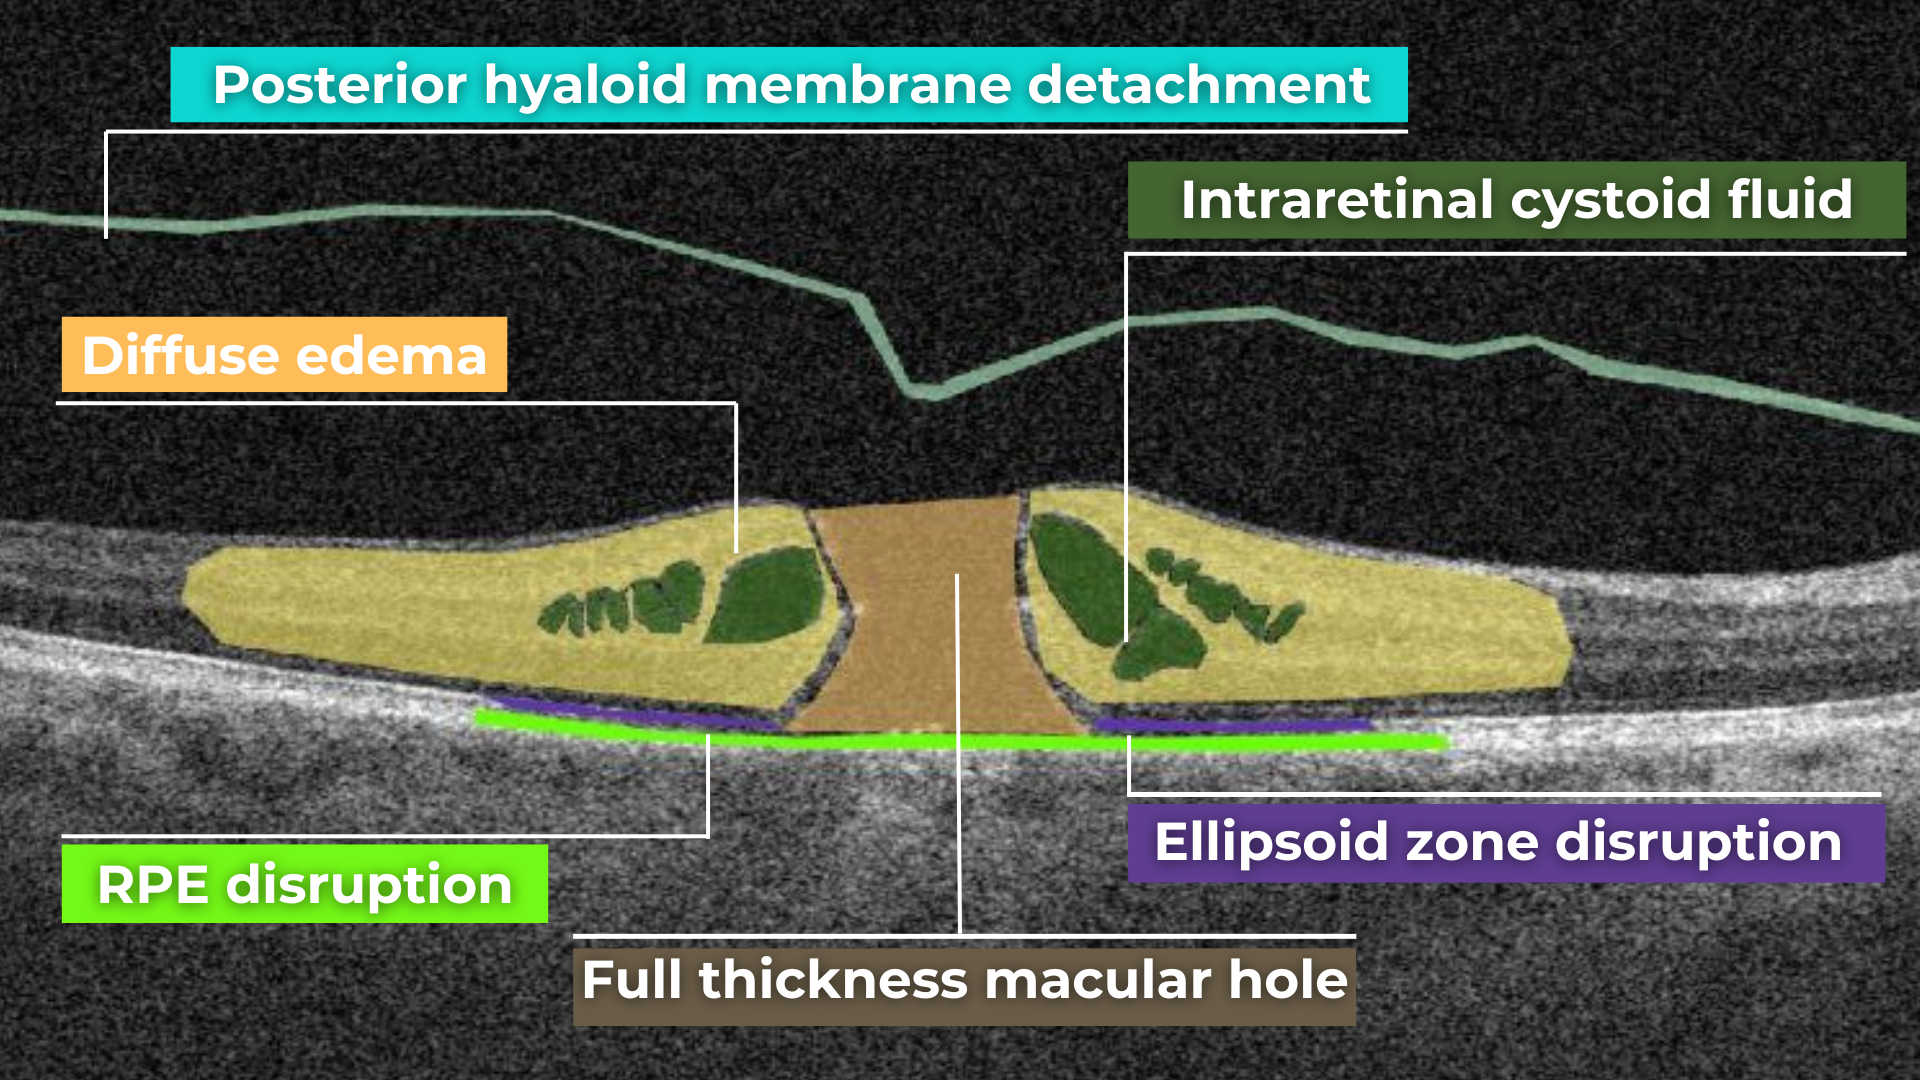
Macular holes are full-thickness defects of retinal tissue involving the anatomic fovea and primarily the foveola of the eye. They are thought to form due to anterior-posterior forces, tangential forces and weakening in the retinal architecture that result in openings in the macular center.
The International Vitreomacular Traction Study (IVTS) Group formed a classification scheme of vitreomacular traction and macular holes based on OCT findings:
- Vitreomacular adhesion (VMA): No distortion of the foveal contour; size of attachment area between hyaloid and retina defined as focal if </= 1500 microns and broad if >1500 microns
- Vitreomacular traction (VMT): Distortion of foveal contour present or intraretinal structural changes in the absence of a full-thickness macular hole; size of attachment area between hyaloid and retina defined as focal if </= 1500 microns and broad if >1500 microns.
- Full-thickness macular hole (FTMH): Full-thickness defect from the internal limiting membrane to the retinal pigment epithelium. Described 3 factors: 1) Size – horizontal diameter at narrowest point: small (≤ 250 μm), medium (250-400 μm), large (> 400 μm); 2) Cause – primary or secondary; 3) Presence of absence of VMT.
Glaucoma
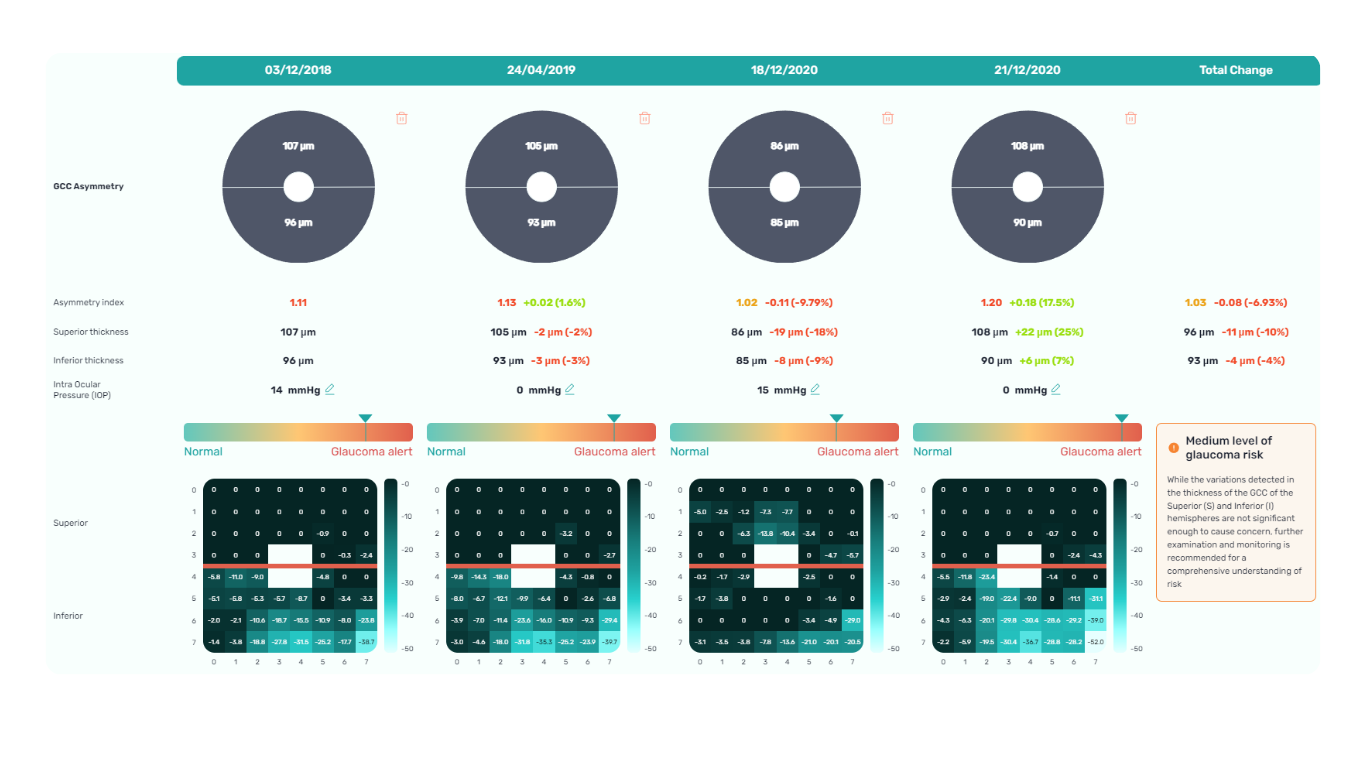
Glaucoma is a progressive optic neuropathy that is multifactorial and degenerative. It is characterized by the death of retinal ganglion cells (RGCs) and their axons, leading to the characteristic optic disc and retinal nerve fiber layer (RNFL) structural changes and associated vision loss. One of the most effective ways to get information about nerve states is OCT.
The Glaucoma OCT test provides valuable information about ganglion cells: damage to the ganglion cells or their processes leads to thinning across respective layers, which we can measure as the thickness of the ganglion cell complex.
Key things to focus on when working with OCT for glaucoma detection:
- Look for thinning of the pRNFL, particularly in the inferior and superior quadrants, asymmetrical thinning between a patient’s eyes
- Assess the thickness of the ganglion cell-inner plexiform layer, macular RNFL, and the overall ganglion cell complex.
- Monitoring: Seek significant decreases over time in pRNFL thickness (≥5 μm globally, ≥7-8 μm in specific sectors) or in average GCIPL thickness (>4μm).
AI-powered OCT interpretation tools, such as Altris AI, AI for OCT, can further assist clinicians by providing automated calculations of RNFL thinning in the upper and lower hemispheres and the asymmetry levels between them.
Summing up
OCT has revolutionized ophthalmology, bringing a wealth of new details and challenges. The human eye can easily miss subtle abnormalities on complex scans, making accurate interpretation critical. While experience is essential, relying solely on “learning by doing” poses risks.
AI-powered OCT interpretation software bridges this gap, offering a safety net during the learning curve and beyond. AI-powered second opinion on OCT scans enhances diagnostic accuracy, empowers clinicians, and allows them to spend more time for a meaningful connection with patients.
Disclaimer: USA FDA 510(k) Class II; Altris Image Management System (Altris IMS); AI/ML models and components intended to use for research purposes only, not for clinical diagnosis purposes.
